Fig. 1
Download original image
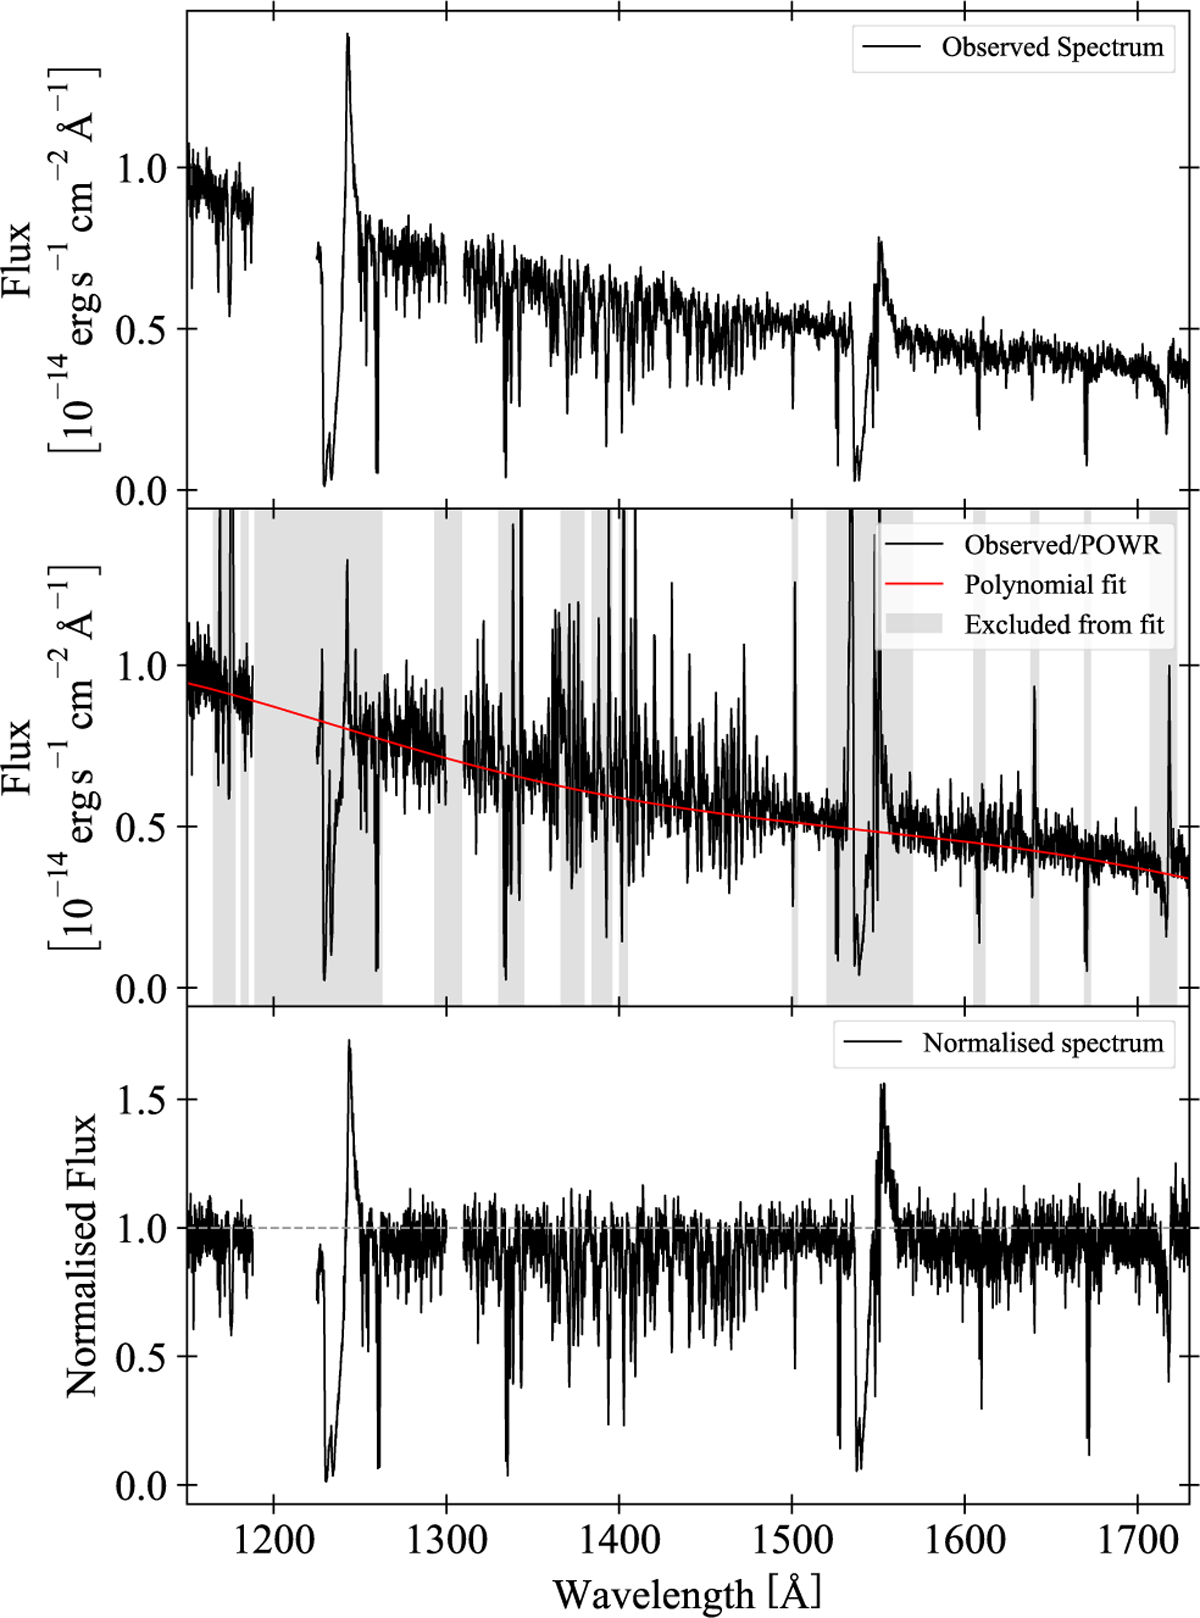
Example of the normalisation process. Top: UV spectrum of A13 in IC 1613. Middle: observed spectrum divided by the best-fitting normalised PoWR model and a polynomial fit through this quotient. The shaded regions indicate parts of the spectrum that are excluded from this polynomial fit process. Bottom: the normalised spectrum, which is the result of dividing the original spectrum by the polynomial fit.
Current usage metrics show cumulative count of Article Views (full-text article views including HTML views, PDF and ePub downloads, according to the available data) and Abstracts Views on Vision4Press platform.
Data correspond to usage on the plateform after 2015. The current usage metrics is available 48-96 hours after online publication and is updated daily on week days.
Initial download of the metrics may take a while.