Fig. 1
Download original image
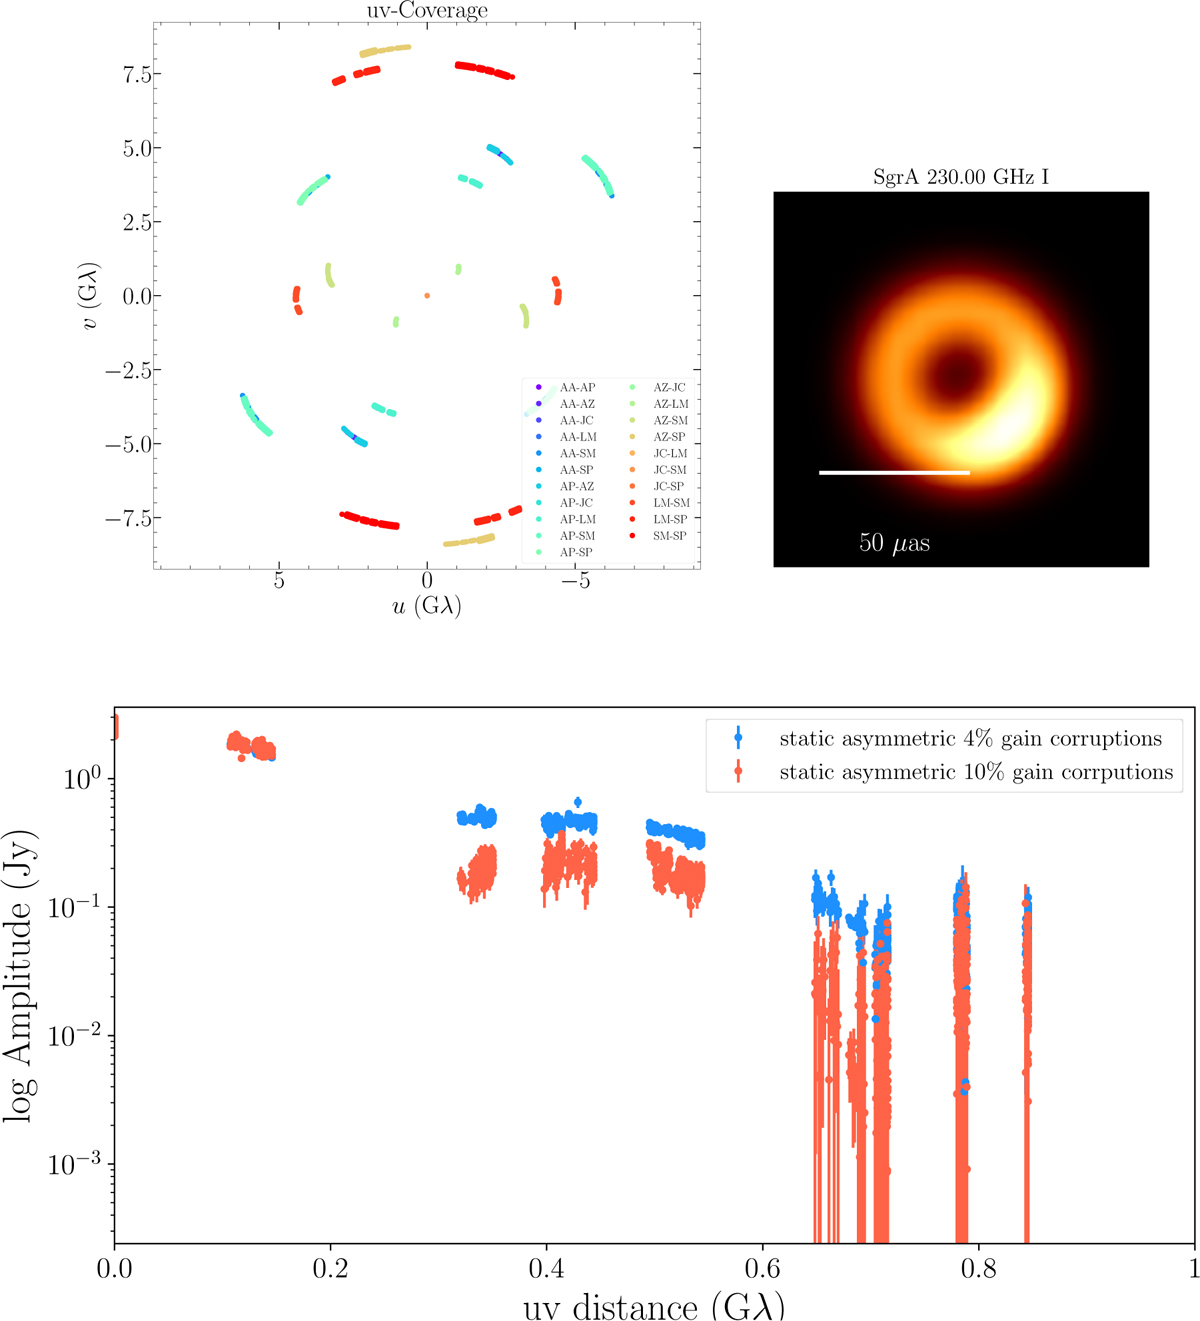
Top left panel: uv coverage for Sgr A* in the best time window of April 7, 2017. The different colors represent different baselines (indicated in the legend). Top right panel: simulated ring in this coverage, with a brightness asymmetry. Bottom panel: log amplitude vs. uv distance for the static scattered asymmetric ring with different gain corruptions. Blue shows 4%, and red shows 10%.
Current usage metrics show cumulative count of Article Views (full-text article views including HTML views, PDF and ePub downloads, according to the available data) and Abstracts Views on Vision4Press platform.
Data correspond to usage on the plateform after 2015. The current usage metrics is available 48-96 hours after online publication and is updated daily on week days.
Initial download of the metrics may take a while.