Open Access
Fig. 9.
Download original image
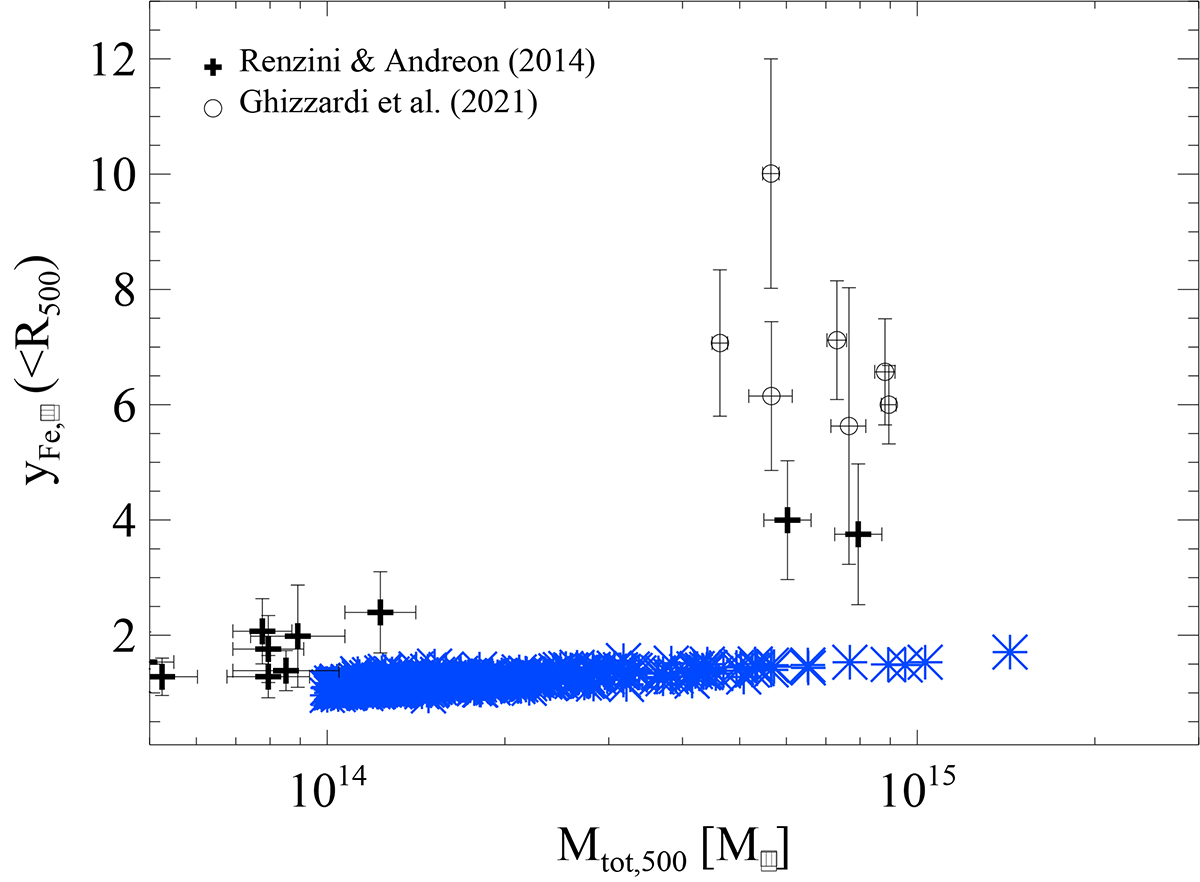
Effective iron yield as a function of cluster mass within R500. Simulation data are marked by blue asterisks, and compared to observational data by Renzini & Andreon (2014) (black crosses) and Ghizzardi et al. (2021) (black open circles).
Current usage metrics show cumulative count of Article Views (full-text article views including HTML views, PDF and ePub downloads, according to the available data) and Abstracts Views on Vision4Press platform.
Data correspond to usage on the plateform after 2015. The current usage metrics is available 48-96 hours after online publication and is updated daily on week days.
Initial download of the metrics may take a while.