Fig. 5.
Download original image
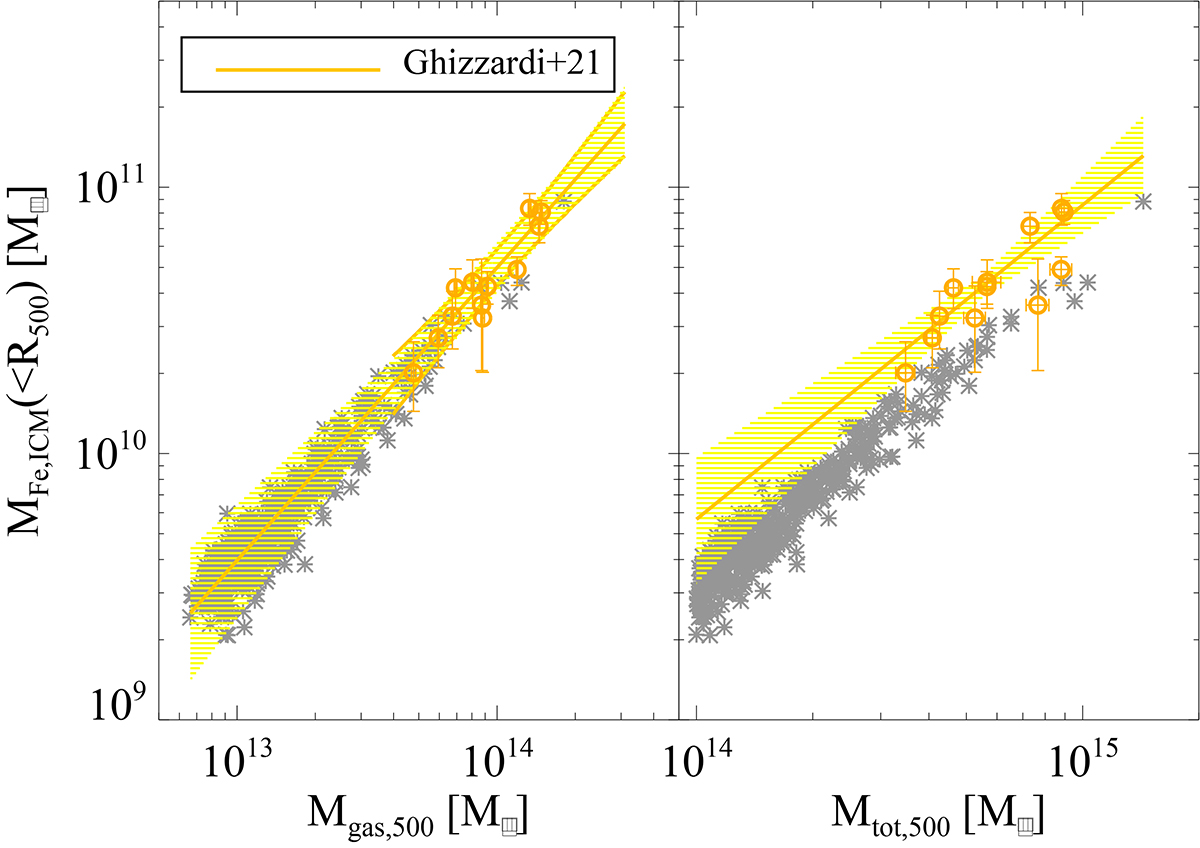
Iron mass in the ICM as a function of gas mass (left) and total mass (right) within R500 (grey asterisks). Orange open circles with errorbars show the results for the X-COP clusters analysed by Ghizzardi et al. (2021). Best-fit observational relations from Ghizzardi et al. (2021) are also reported (solid lines) with 1-σ confidence regions (yellow shaded areas).
Current usage metrics show cumulative count of Article Views (full-text article views including HTML views, PDF and ePub downloads, according to the available data) and Abstracts Views on Vision4Press platform.
Data correspond to usage on the plateform after 2015. The current usage metrics is available 48-96 hours after online publication and is updated daily on week days.
Initial download of the metrics may take a while.