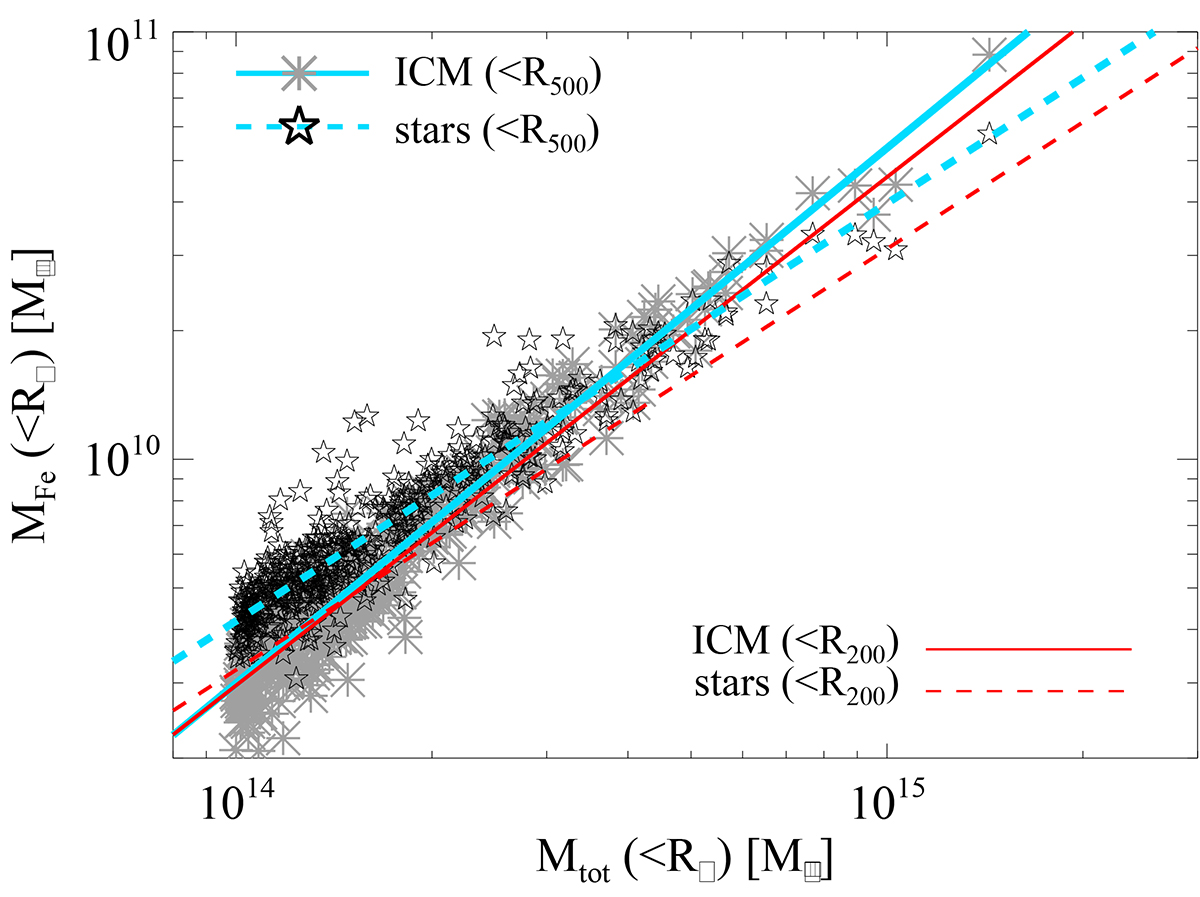
Fig. 4.
Download original image
Relation between iron mass in gas (grey asterisks) and stars (black stars) and total mass, within R500. Lines refer to the best-fit relations between MFe(<R500)–Mtot,500 (cyan lines), for gas (solid) and stars (dashed) respectively. Overplotted for comparison, the best-fit relations for the R200 region, MFe(<R200)–Mtot,200 (gas: red solid line; stars: red dashed line).
Current usage metrics show cumulative count of Article Views (full-text article views including HTML views, PDF and ePub downloads, according to the available data) and Abstracts Views on Vision4Press platform.
Data correspond to usage on the plateform after 2015. The current usage metrics is available 48-96 hours after online publication and is updated daily on week days.
Initial download of the metrics may take a while.