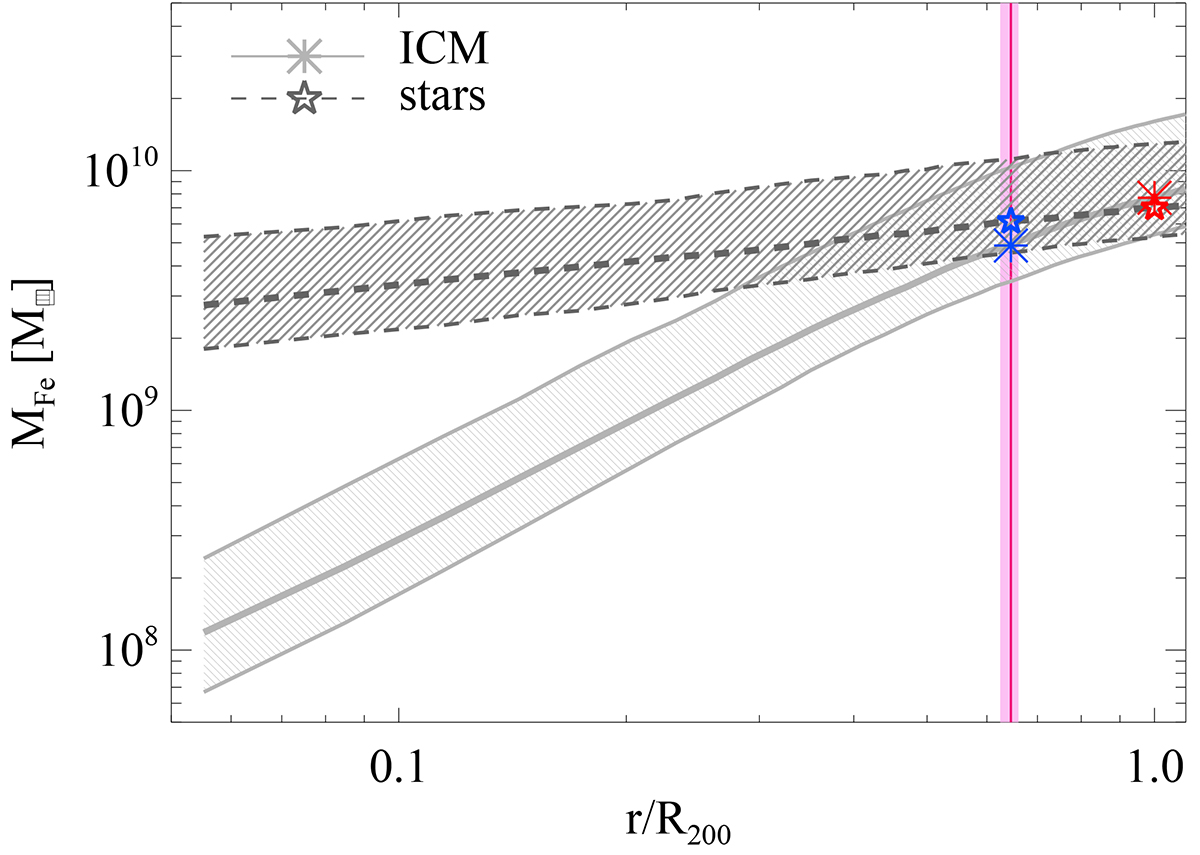
Fig. 3.
Download original image
Median radial profiles of iron mass in the ICM (solid line) and in the stellar component (dashed line) up to R200. The scatter on the sample (data comprised between the 16th and 84th percentile) is marked in both cases by the grey shaded area. The coloured symbols mark the median value of MFe in the gas (asterisks) and in the stars (stars) at R500 (blue) and R200 (red) respectively. The vertical pink line and shaded area indicate the median value of R500/R200 and the corresponding scatter.
Current usage metrics show cumulative count of Article Views (full-text article views including HTML views, PDF and ePub downloads, according to the available data) and Abstracts Views on Vision4Press platform.
Data correspond to usage on the plateform after 2015. The current usage metrics is available 48-96 hours after online publication and is updated daily on week days.
Initial download of the metrics may take a while.