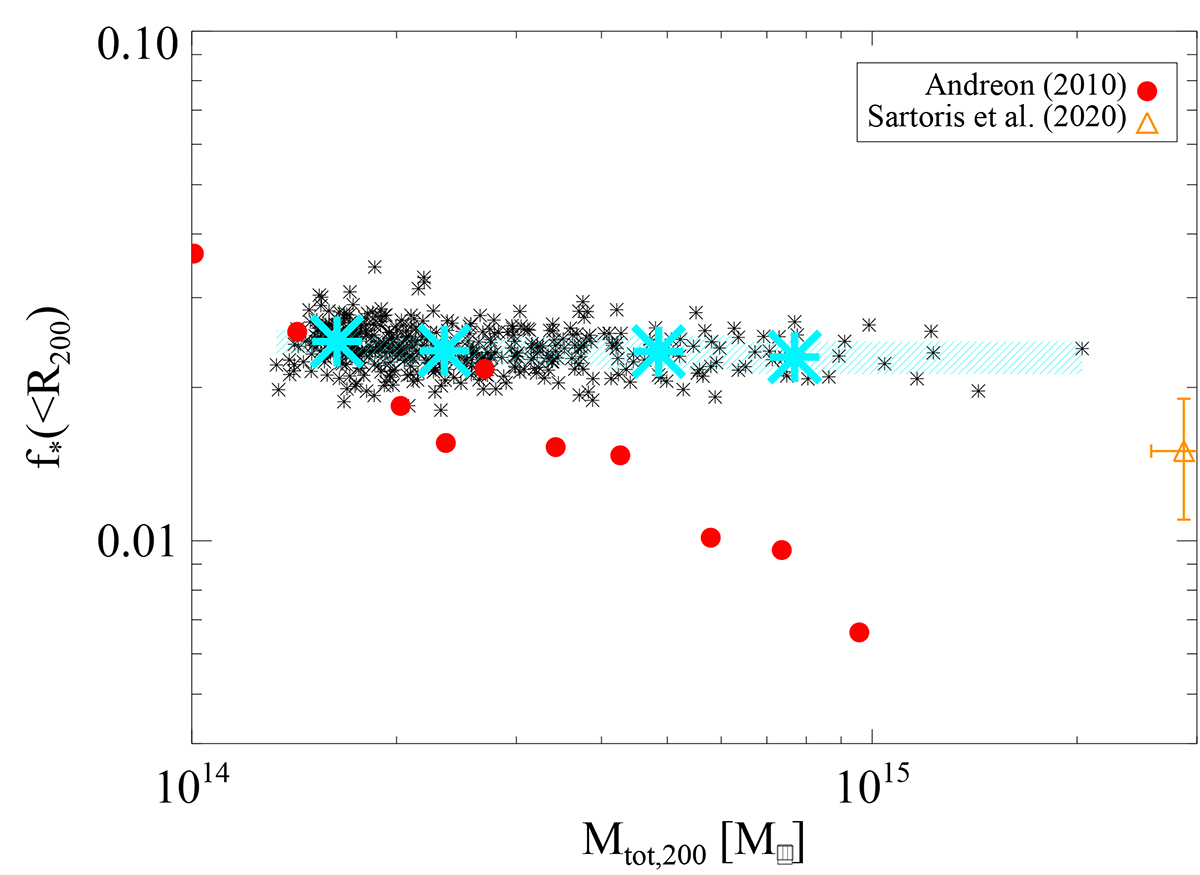
Fig. E.1.
Download original image
Relation between stellar fraction and total mass, for the region within R200. Simulation data for the MAGNETICUM sample are marked as black asterisks, with cyan big asterisks and shaded area indicating the median values and scatter in four bins of total mass. Observational data are taken from Andreon (2010) (red filled circles) and Sartoris et al. (2020) (orange triangle).
Current usage metrics show cumulative count of Article Views (full-text article views including HTML views, PDF and ePub downloads, according to the available data) and Abstracts Views on Vision4Press platform.
Data correspond to usage on the plateform after 2015. The current usage metrics is available 48-96 hours after online publication and is updated daily on week days.
Initial download of the metrics may take a while.