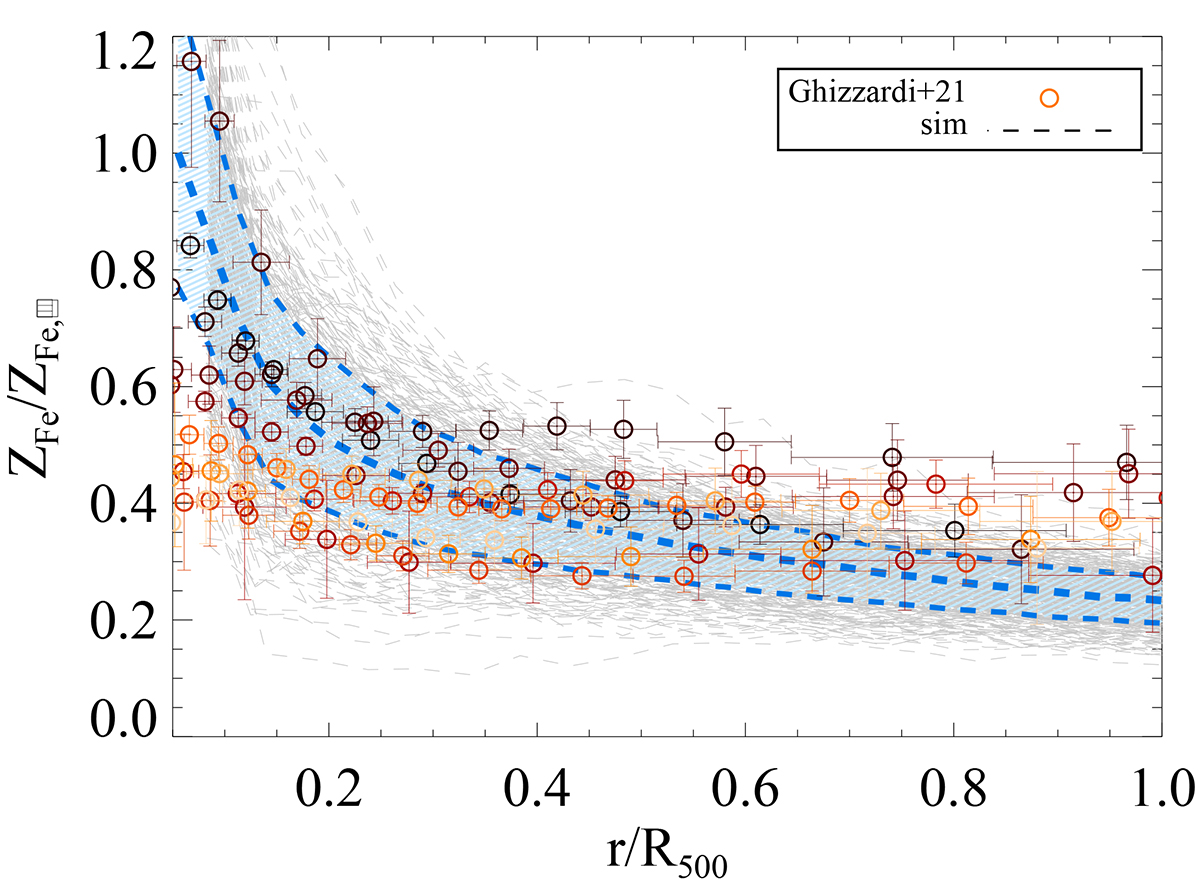
Fig. A.1.
Download original image
Iron abundance profiles up to R500 for the individual MAGNETICUM sample (thin dashed grey lines). Simulated median profile and scatter are marked as blue thick dashed line and shaded area. Coloured datapoints refer to the observational profiles for individual X-COP clusters by Ghizzardi et al. (2021), with normalisation rescaled to the reference solar abundance by Asplund et al. (2009), used for the profiles of the simulated clusters.
Current usage metrics show cumulative count of Article Views (full-text article views including HTML views, PDF and ePub downloads, according to the available data) and Abstracts Views on Vision4Press platform.
Data correspond to usage on the plateform after 2015. The current usage metrics is available 48-96 hours after online publication and is updated daily on week days.
Initial download of the metrics may take a while.