Open Access
Fig. 1.
Download original image
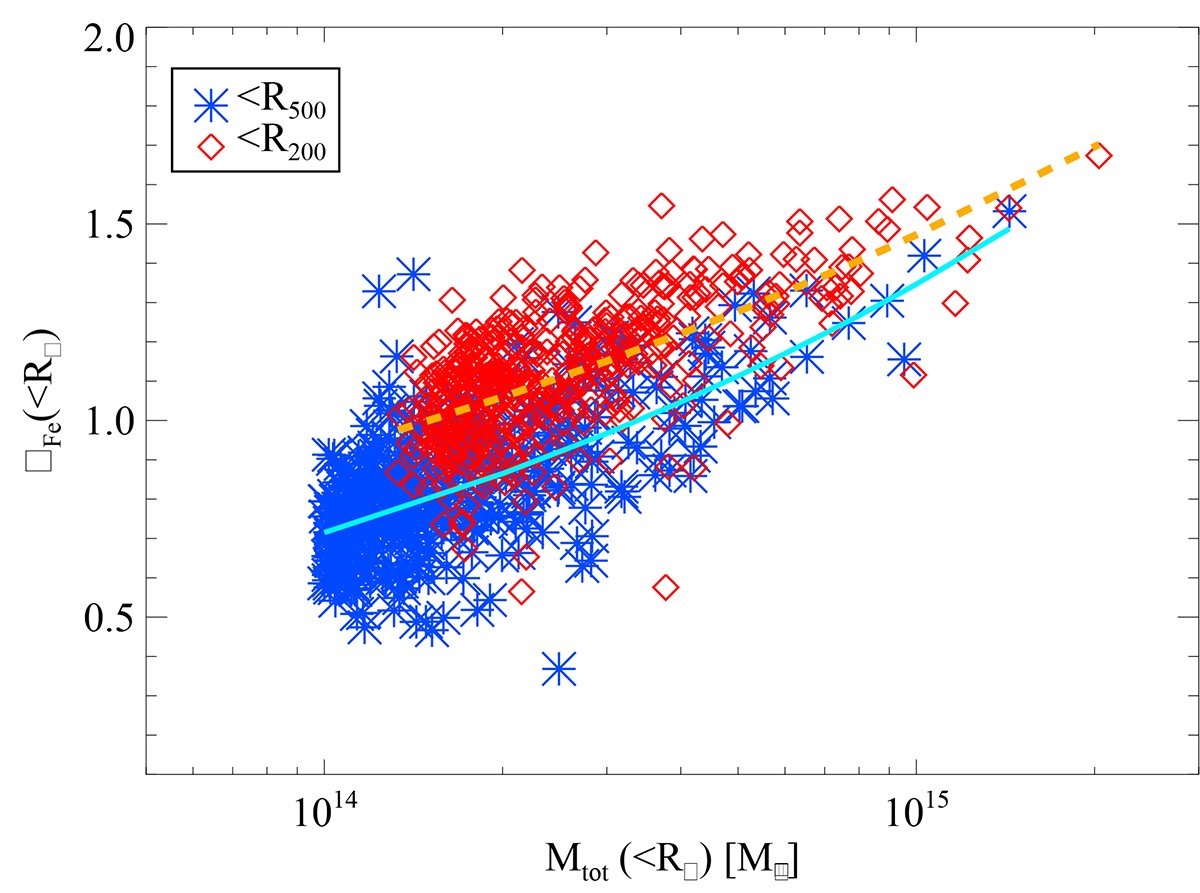
Iron share between ICM and stellar component as a function of the total system mass. On both axes, the quantities are computed either within R500 (blue asterisks) or within R200 (red diamonds). The two lines correspond to the linear best fit of the two datasets in log-log space.
Current usage metrics show cumulative count of Article Views (full-text article views including HTML views, PDF and ePub downloads, according to the available data) and Abstracts Views on Vision4Press platform.
Data correspond to usage on the plateform after 2015. The current usage metrics is available 48-96 hours after online publication and is updated daily on week days.
Initial download of the metrics may take a while.