Fig. 5.
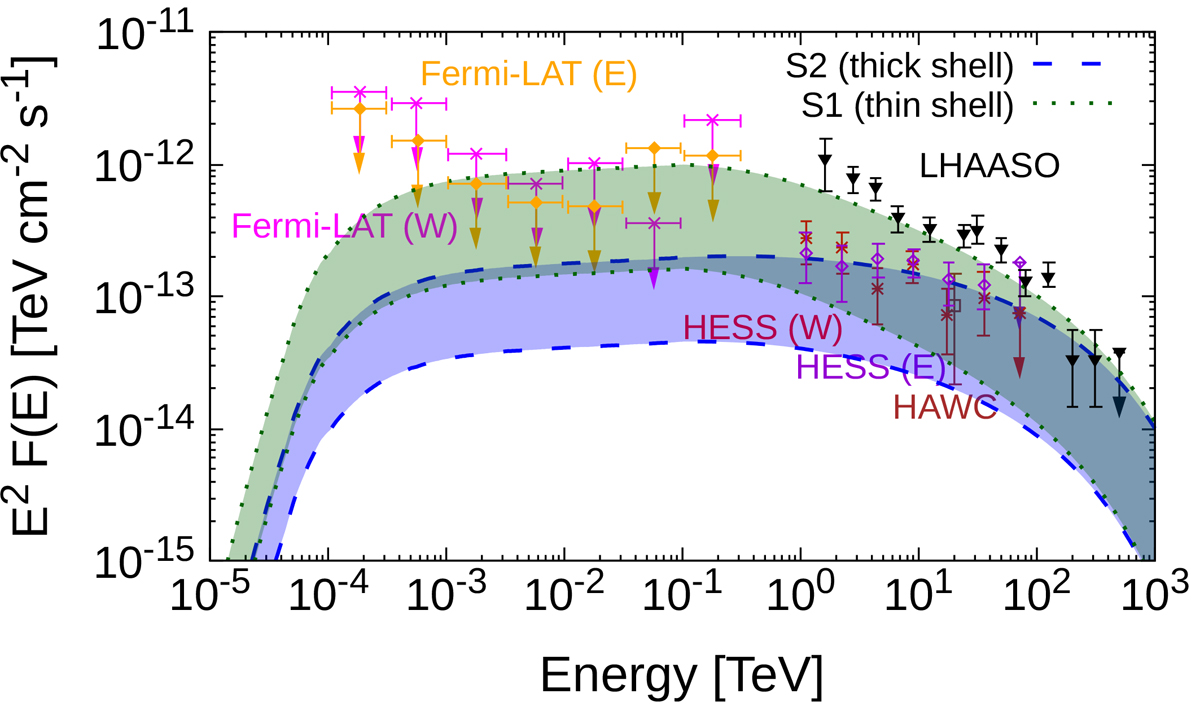
Download original image
Spectral energy distribution of gamma-ray emission from SS 433. Colored markers indicate flux measurements obtained with H.E.S.S. and HAWC. More recent data obtained by LHAASO are shown with black markers. The upper limits imposed by Fermi-LAT on the GeV emission from the eastern (E) and western (W) jets are overplotted with colored downward-pointing arrows. The predicted (hadronic) gamma-ray spectrum from the bubble is overplotted for the two scenarios presented in Fig. 1. The shaded region shows the expected range of gamma-ray emission when varying the terminal wind speed by a factor of two.
Current usage metrics show cumulative count of Article Views (full-text article views including HTML views, PDF and ePub downloads, according to the available data) and Abstracts Views on Vision4Press platform.
Data correspond to usage on the plateform after 2015. The current usage metrics is available 48-96 hours after online publication and is updated daily on week days.
Initial download of the metrics may take a while.