Fig. 8.
Download original image
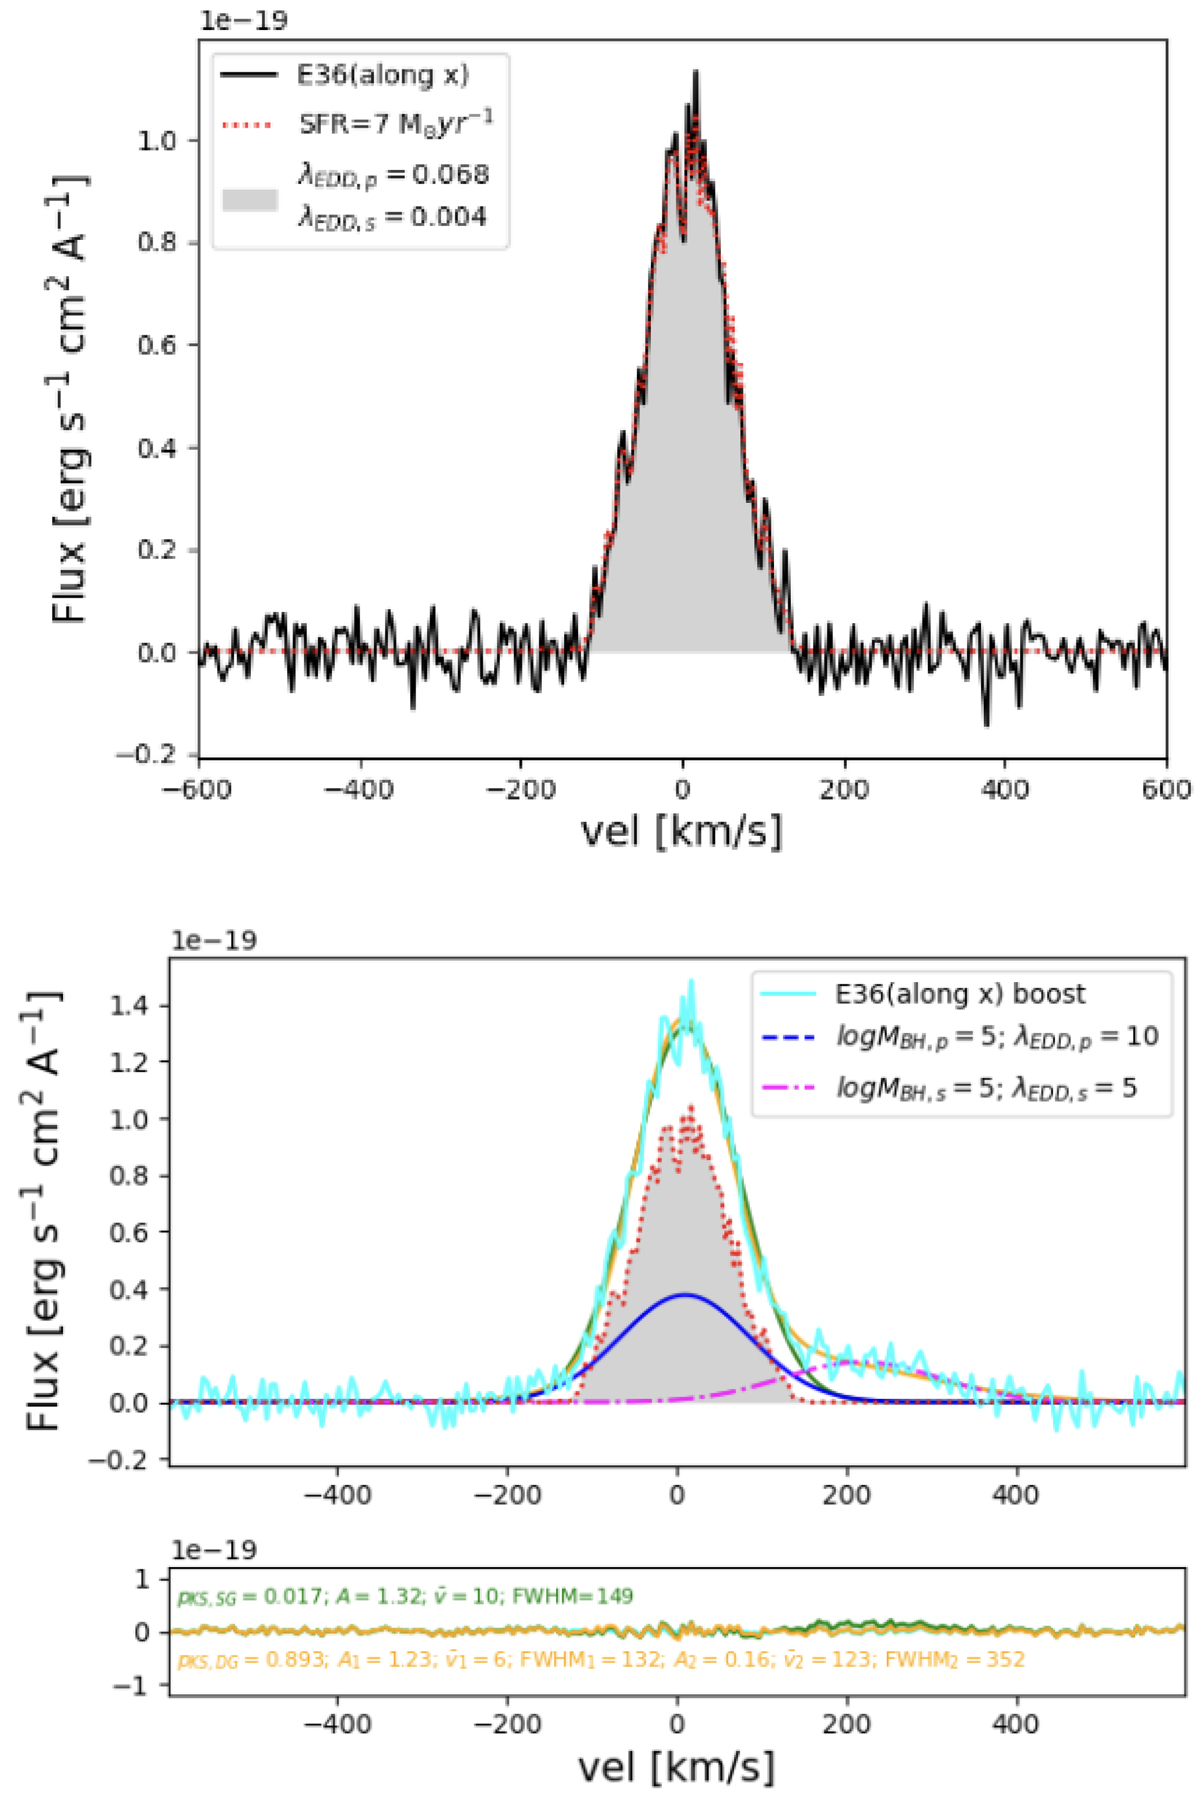
Upper panel: Predicted Hα line profile from simulations for E36 along the x-direction. The grey-shaded region represents the result of our calculations. The solid black line denotes the total flux from the star-forming regions and the accreting primary and secondary MBHs. The red-dotted line shows the contribution only from the SF. To simulate noise, we add to our simulated spectra (in velocity bins of Δ v = 5 km s−1) a random number extracted by a Gaussian distribution with zero mean and a standard deviation of ![]() . Bottom panel: Re-simulated Hα profile for E36 in the LOS along the x-direction. We consider the case of equal-massed MBHs, where the accretion rate of the primary MBH is twice the that of the secondary MBH. The solid blue and dashed pink lines represent the contribution from the primary and secondary MBH, respectively. The bottom inset indicates the added random noise in the synthetic spectrum (cyan) along with the residual of the best-fitting model (green for the SG and orange for the DG, respectively) as explained in Sect. 5.2.
. Bottom panel: Re-simulated Hα profile for E36 in the LOS along the x-direction. We consider the case of equal-massed MBHs, where the accretion rate of the primary MBH is twice the that of the secondary MBH. The solid blue and dashed pink lines represent the contribution from the primary and secondary MBH, respectively. The bottom inset indicates the added random noise in the synthetic spectrum (cyan) along with the residual of the best-fitting model (green for the SG and orange for the DG, respectively) as explained in Sect. 5.2.
Current usage metrics show cumulative count of Article Views (full-text article views including HTML views, PDF and ePub downloads, according to the available data) and Abstracts Views on Vision4Press platform.
Data correspond to usage on the plateform after 2015. The current usage metrics is available 48-96 hours after online publication and is updated daily on week days.
Initial download of the metrics may take a while.