Fig. 7.
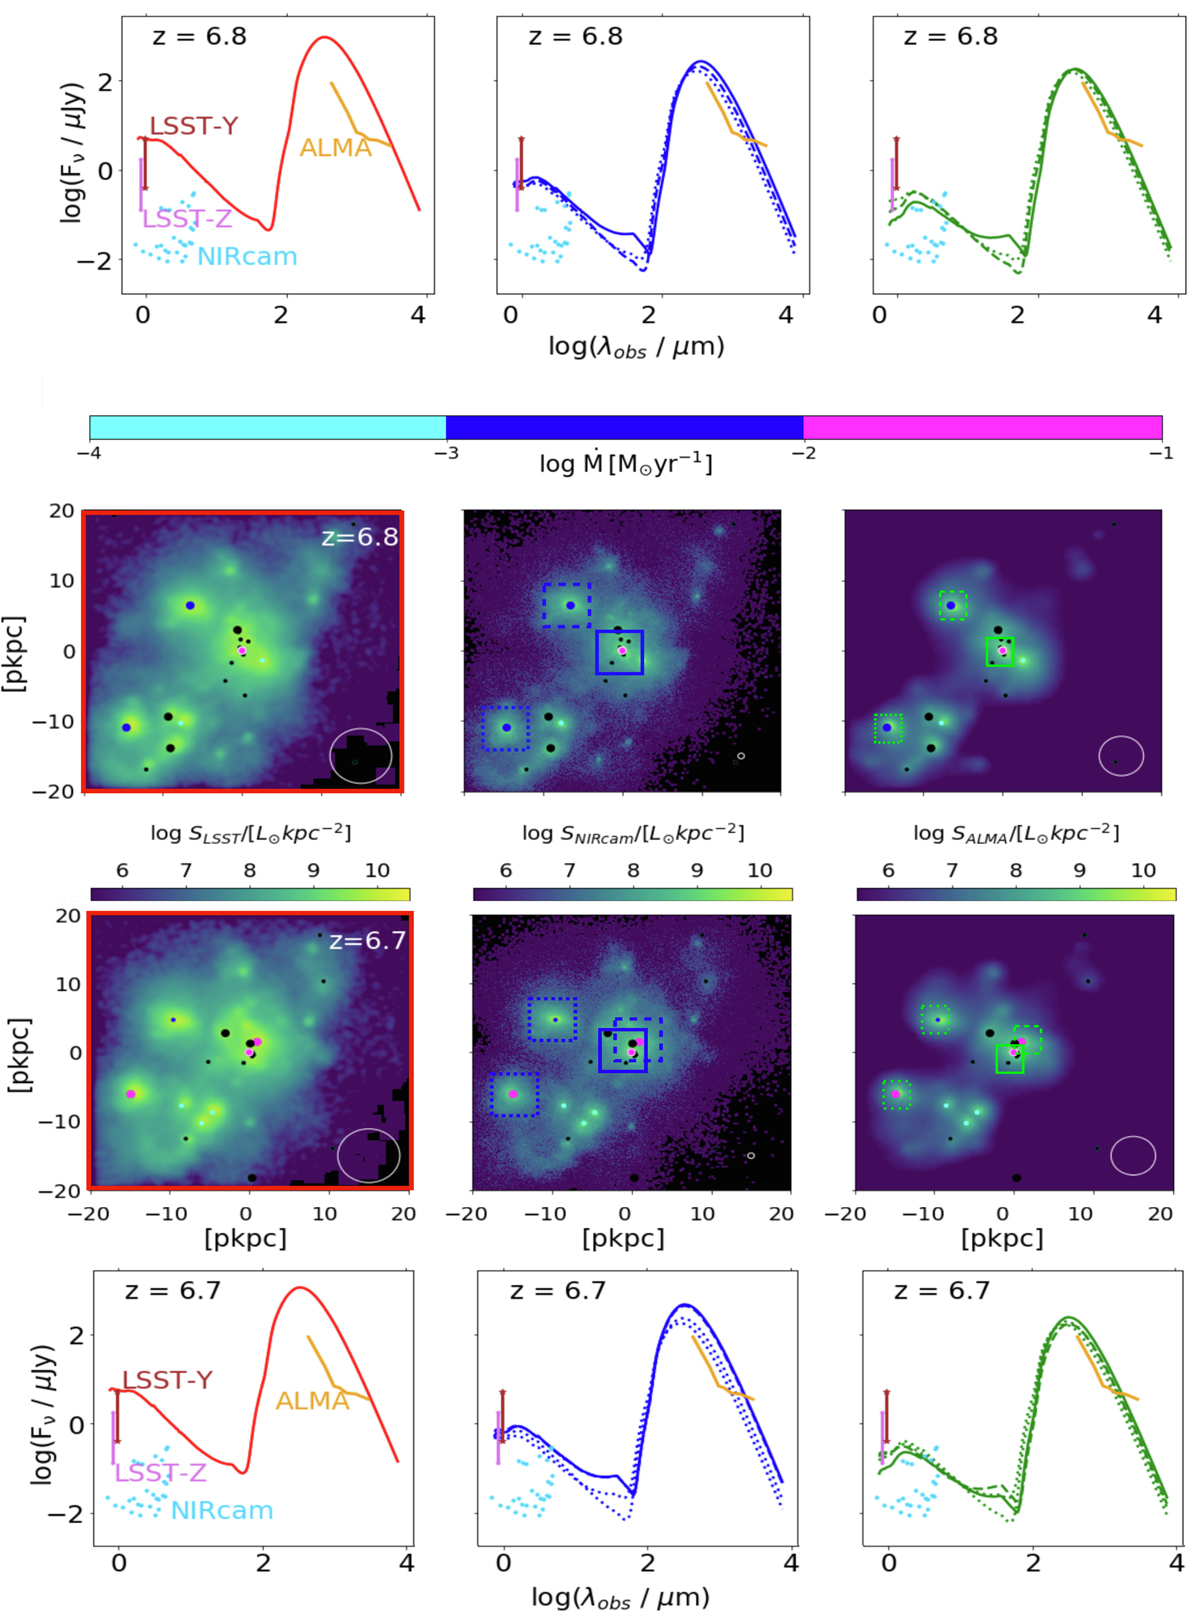
Download original image
Simulated maps (second and third row) in different observable bands and SEDs (first and bottom row) relative to event 31. From left to right we show the maps in the wavelength range of LSST (0.9–1.1 μm), NIRcam (3.8–5.1 μm), and ALMA (0.8–1.1 mm). Each map is convolved to match the angular resolution of the corresponding instruments considered: LSST (0.7″), NIRCAM (0.07″), and ALMA (0.5″). These values correspond to beam sizes of approximately 4 kpc, 0.4 kpc, and 3 kpc, respectively, at z ∼ 6.8, and are shown as white circles at the bottom of each panel in the second and third rows. The circles with white-coloured edges represent the coalescing MBHs, while the others represent the non-coalescing MBHs in the same halo. MBHs are coloured based on their mass accretion rates: MBHs with Ṁ < 10−4 M⊙ are represented in black, 10−4 M⊙ Ṁ < 10−3 M⊙ in cyan, and 10−3 M⊙ Ṁ < 10−2 M⊙ in blue. The MBHs with Ṁ > 10−1 M⊙ are represented in magenta. Small, medium, and large circles represent MBHs with masses MBH ≤ 105 M⊙, 105.5 M⊙ ≤ MBH ≤ 106 M⊙ and MBH > 106 M⊙, respectively. The top and bottom rows show the SEDs at z = 6.8 and z = 6.7, respectively. The left panel indicates the emission across the entire field of view. In the middle and right panels, square regions of 2 kpc and 800 pc, respectively, are selected around the merging BH (solid contour in the emission maps) to extract the SED (solid line in the SED plots). The same procedure is applied to other AGN in the field of view (dashed contour in the emission maps and dashed line in the SED plots).
Current usage metrics show cumulative count of Article Views (full-text article views including HTML views, PDF and ePub downloads, according to the available data) and Abstracts Views on Vision4Press platform.
Data correspond to usage on the plateform after 2015. The current usage metrics is available 48-96 hours after online publication and is updated daily on week days.
Initial download of the metrics may take a while.