Fig. 6.
Download original image
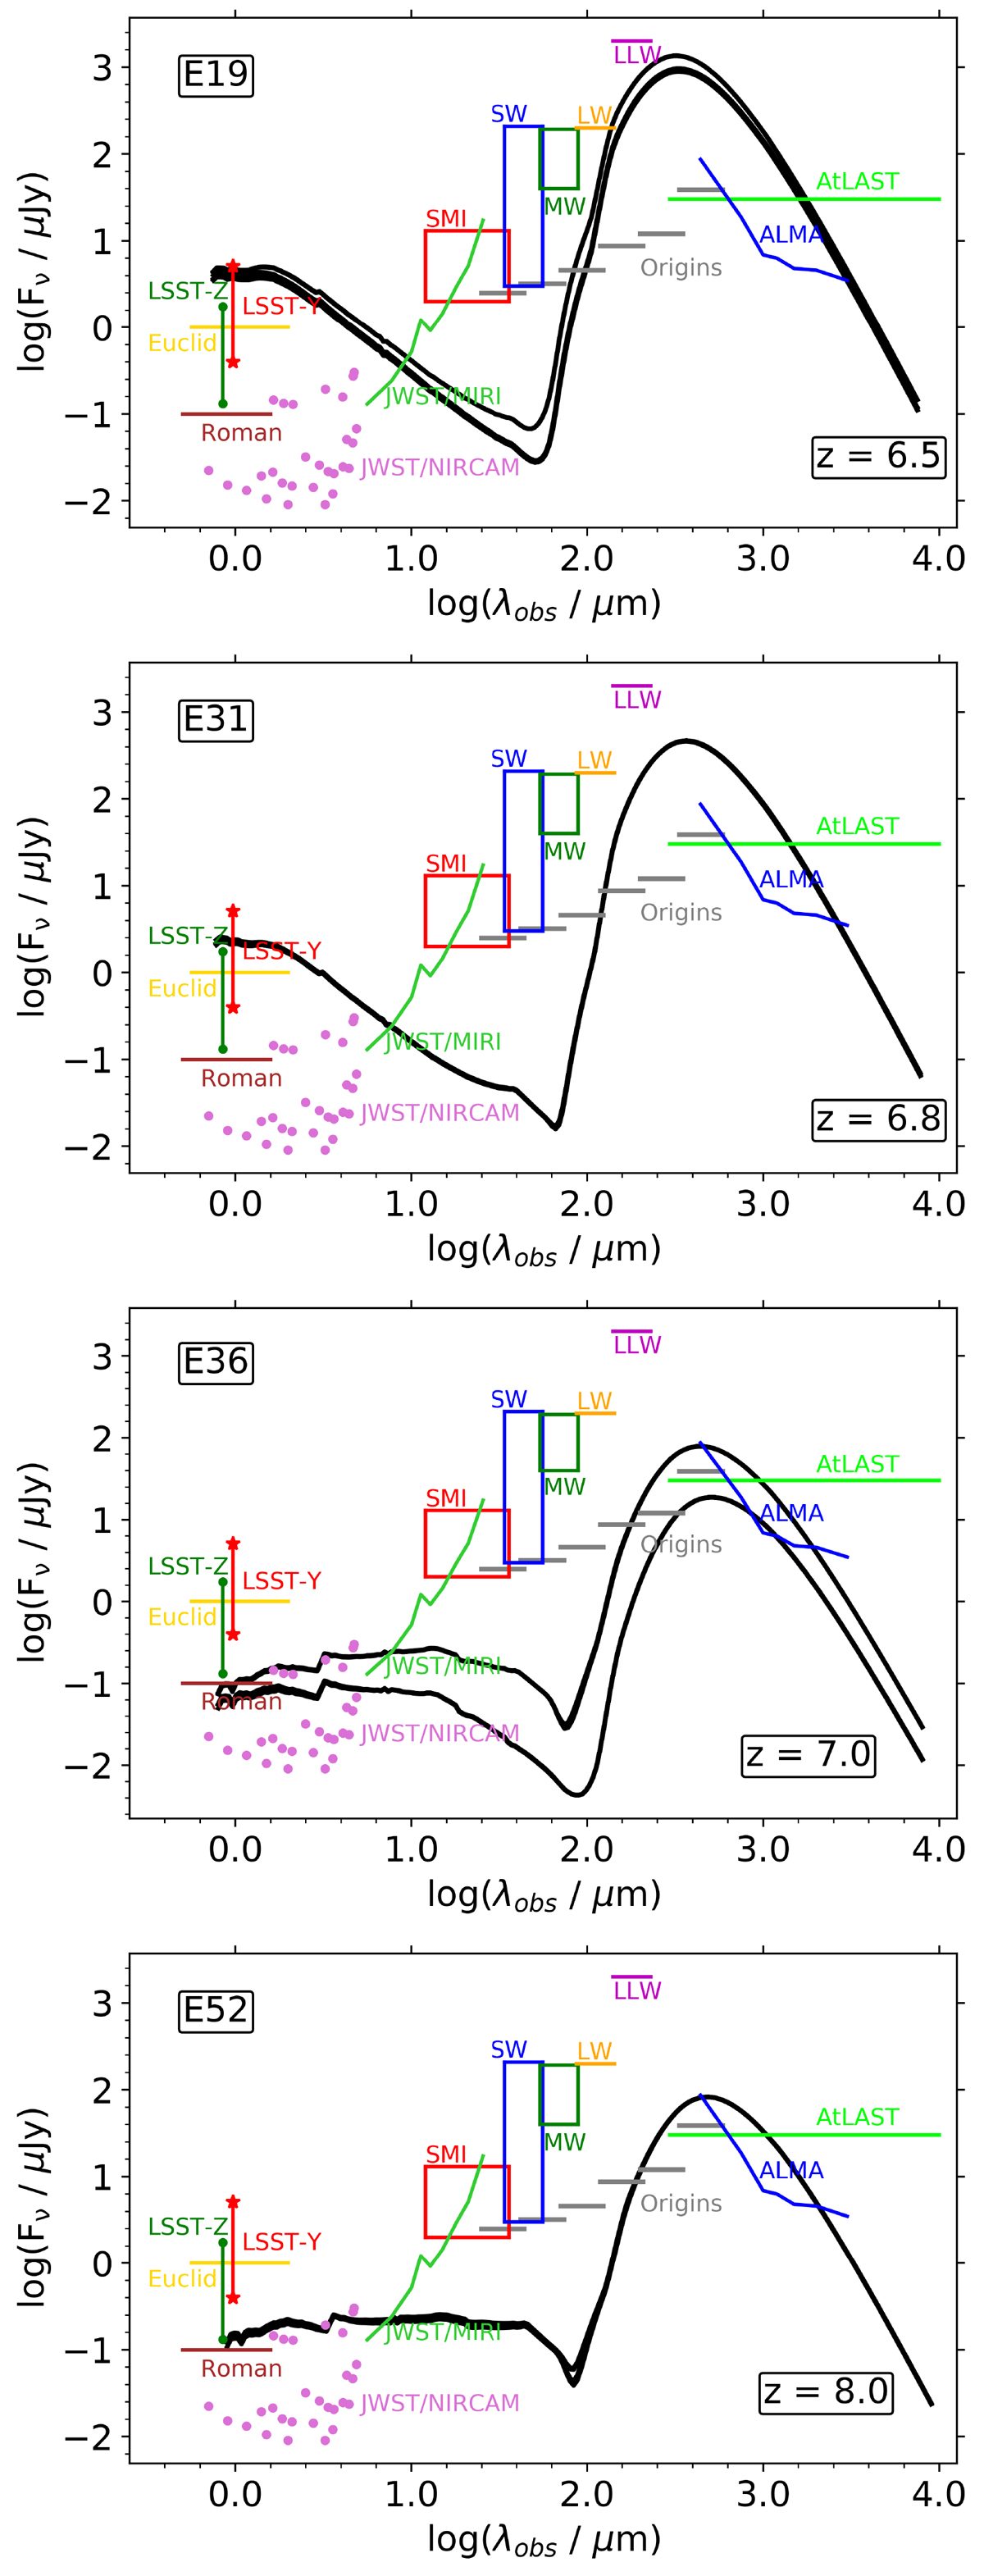
Spectral energy distributions of the selected events: E19 at z = 6.5 (first row), E31 at z = 6.8 (second), E36 at z = 7.0 (third), and E52 (last) at z = 8.0, extracted from different LOSs shown as black solid lines in Fig. 5, from an aperture containing the SF region (rSF = 8.2, 7.4, 5.0, 4.8 kpc, respectively). The synthetic SEDs are compared with the sensitivities of various EM telescopes. The following are shown: LSST filters Z (dark green vertical line) and Y (red vertical line); Roman (brown horizontal line); JWST NIRCAM (orchid-coloured dots); JWST-MIRI (green curved line, for an exposure time of ∼3 h); Origins-like (grey horizontal lines, at 5σ in 1 hour), SPICA-like (red, blue, green boxes; yellow and magenta horizontal lines at 5σ in 1 h, represented by the top portions of the rectangles, and at 3σ by the lower sides of the rectangle; when the confusion limit is reached within an hour, sensitivities are indicated by the lines); ALMA (blue curved line, 10 h); and AtLAST (light green horizontal line).
Current usage metrics show cumulative count of Article Views (full-text article views including HTML views, PDF and ePub downloads, according to the available data) and Abstracts Views on Vision4Press platform.
Data correspond to usage on the plateform after 2015. The current usage metrics is available 48-96 hours after online publication and is updated daily on week days.
Initial download of the metrics may take a while.