Fig. 5.
Download original image
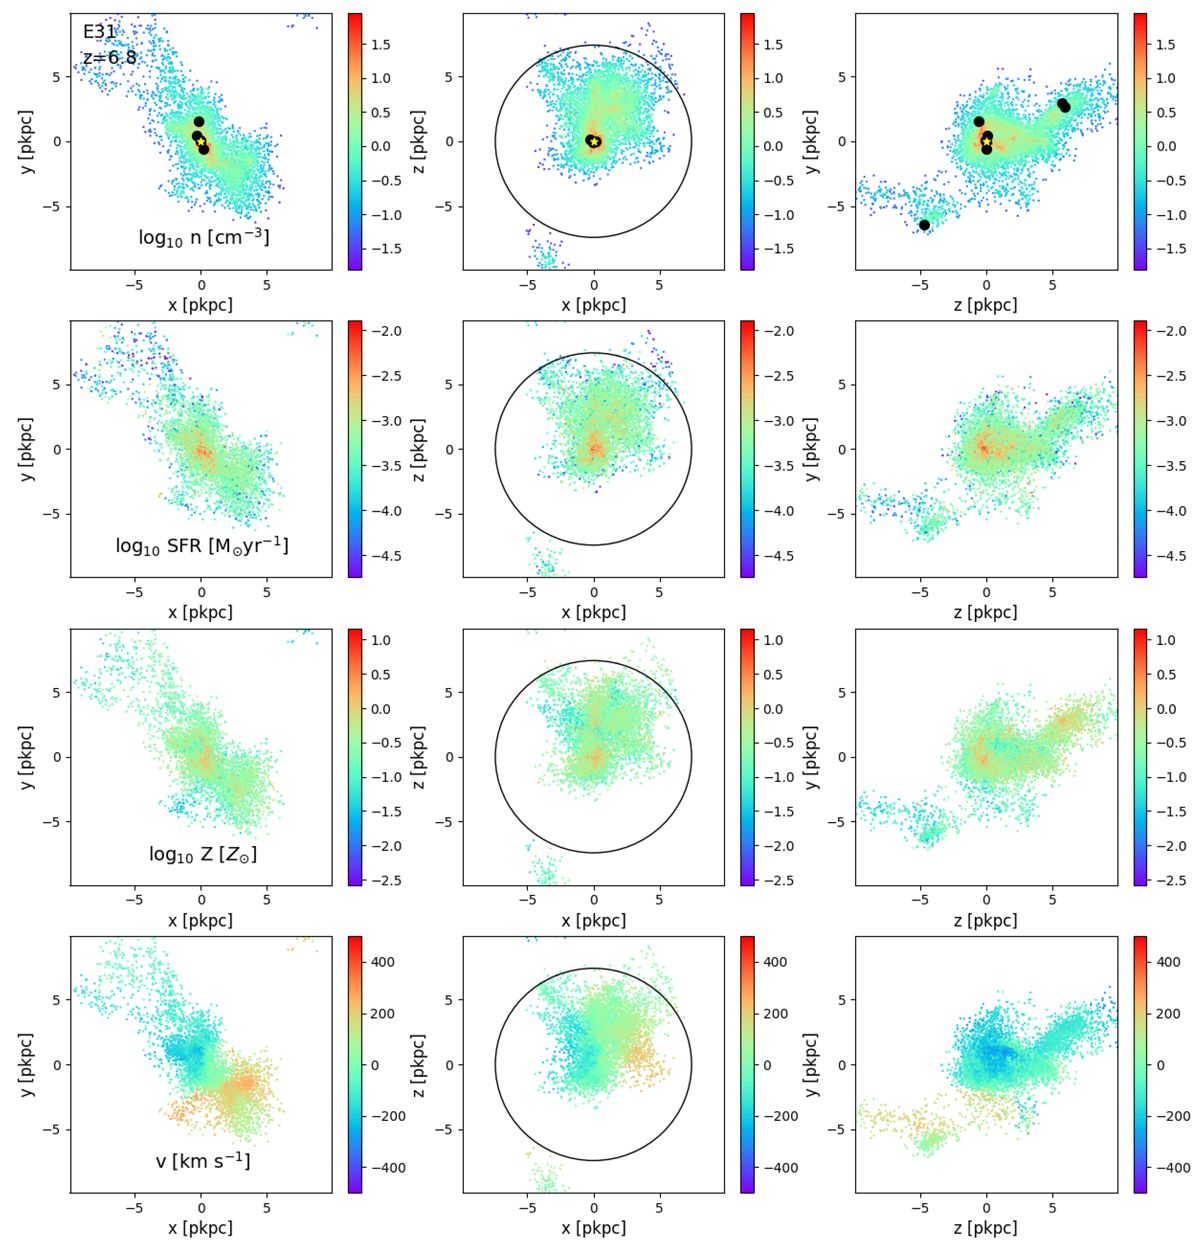
3D representation of the intrinsic properties of E31 at z = 6.8. Each box has a side of 20 pkpc and 1.2 pkpc along the z-, y-, and x-directions (in the left, middle, and right panel, respectively) for three different LOSs. First row: Gas density of the star-forming particles. The black circle identifies the region adopted to compute the intrinsic properties in Sect. 3.1, corresponding to 30% of the virial radius. The filled black circles represent the location of the MBHs in the simulation. In particular, the location of the merger event is denoted by a yellow-filled star. The location of the MBHs and of the merger event remain the same for all rows. To avoid clutter and to provide a better view of the host galaxy’s intrinsic properties, the black-filled circles and the yellow-filled star are presented only in the first row. Second row: Star formation rate of the SF particles. Third row: Gas metallicity of the SF particles. Fourth row: Gas velocity of the SF particles along the different LOS considered.
Current usage metrics show cumulative count of Article Views (full-text article views including HTML views, PDF and ePub downloads, according to the available data) and Abstracts Views on Vision4Press platform.
Data correspond to usage on the plateform after 2015. The current usage metrics is available 48-96 hours after online publication and is updated daily on week days.
Initial download of the metrics may take a while.