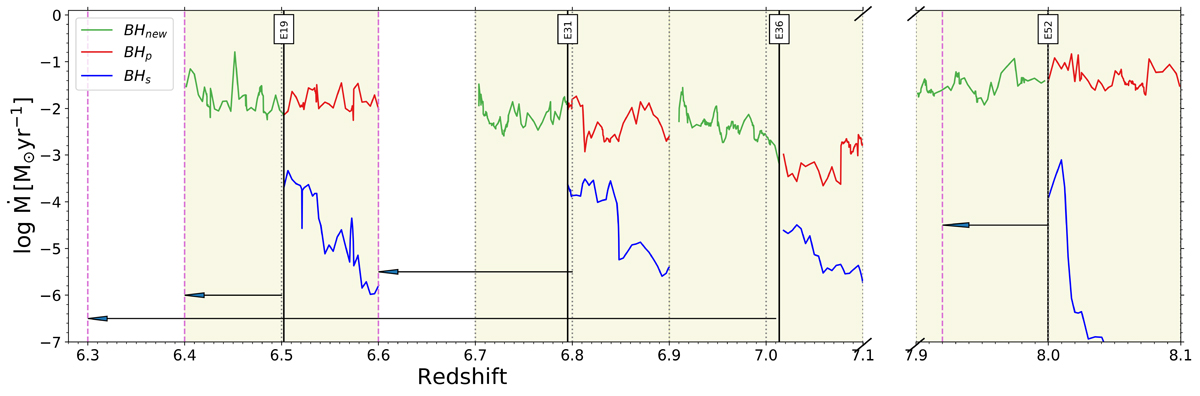
Fig. 4.
Download original image
Redshift evolution of the MBH accretion rates (Ṁ) for LDEs. We select four events for which the merger occurs at z ≳ 6 after taking into account the time delays due to DF. For each event, the red (blue) line refers to the primary (secondary) MBH, labelled BHp (BHs) in the figure, while the green line shows Ṁ of the new MBH resulting from the merger (BHnew). The black solid vertical lines show the times at which the merger occurs in the simulation, according to the instantaneous merging approximation. The vertical pink-dashed lines show the new redshifts at which the BHs merge after factoring in delays due to DF. The black arrows show the change in the merger redshifts upon considering time delays due to DF in post-processing. The yellow patches show the time span for which the selected BHs evolve without undergoing any other mergers between the two snapshots (the redshifts of the snapshots are depicted by vertical black-dotted lines).
Current usage metrics show cumulative count of Article Views (full-text article views including HTML views, PDF and ePub downloads, according to the available data) and Abstracts Views on Vision4Press platform.
Data correspond to usage on the plateform after 2015. The current usage metrics is available 48-96 hours after online publication and is updated daily on week days.
Initial download of the metrics may take a while.