Fig. 3.
Download original image
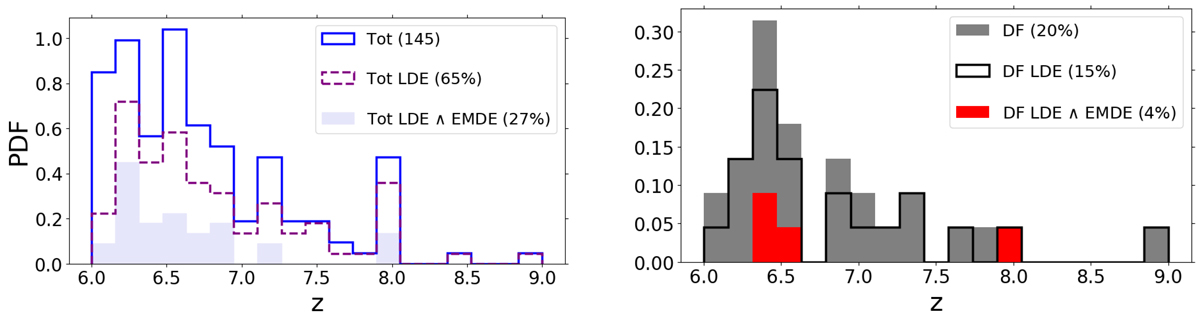
Probability distribution functions of all merger events and all LDEs (left panel), and DF events and DF LDEs (right panel). In the left panel, the blue solid line represents the total number of merger events in our AGN_fid run. The purple dashed line represents the LDEs in the AGN_fid, while the lavender area further denotes the LDEs which are also detectable in the UV, X-ray, CII, and/or FIR bands by JWST, LynX, and ALMA. In the right panel, the grey area represents the mergers that take place at z > 6 after taking into account the time delay due to DF. The black solid line shows the LDEs of these aforementioned mergers, while the red area represents the LDEs and EMDEs from these mergers.
Current usage metrics show cumulative count of Article Views (full-text article views including HTML views, PDF and ePub downloads, according to the available data) and Abstracts Views on Vision4Press platform.
Data correspond to usage on the plateform after 2015. The current usage metrics is available 48-96 hours after online publication and is updated daily on week days.
Initial download of the metrics may take a while.