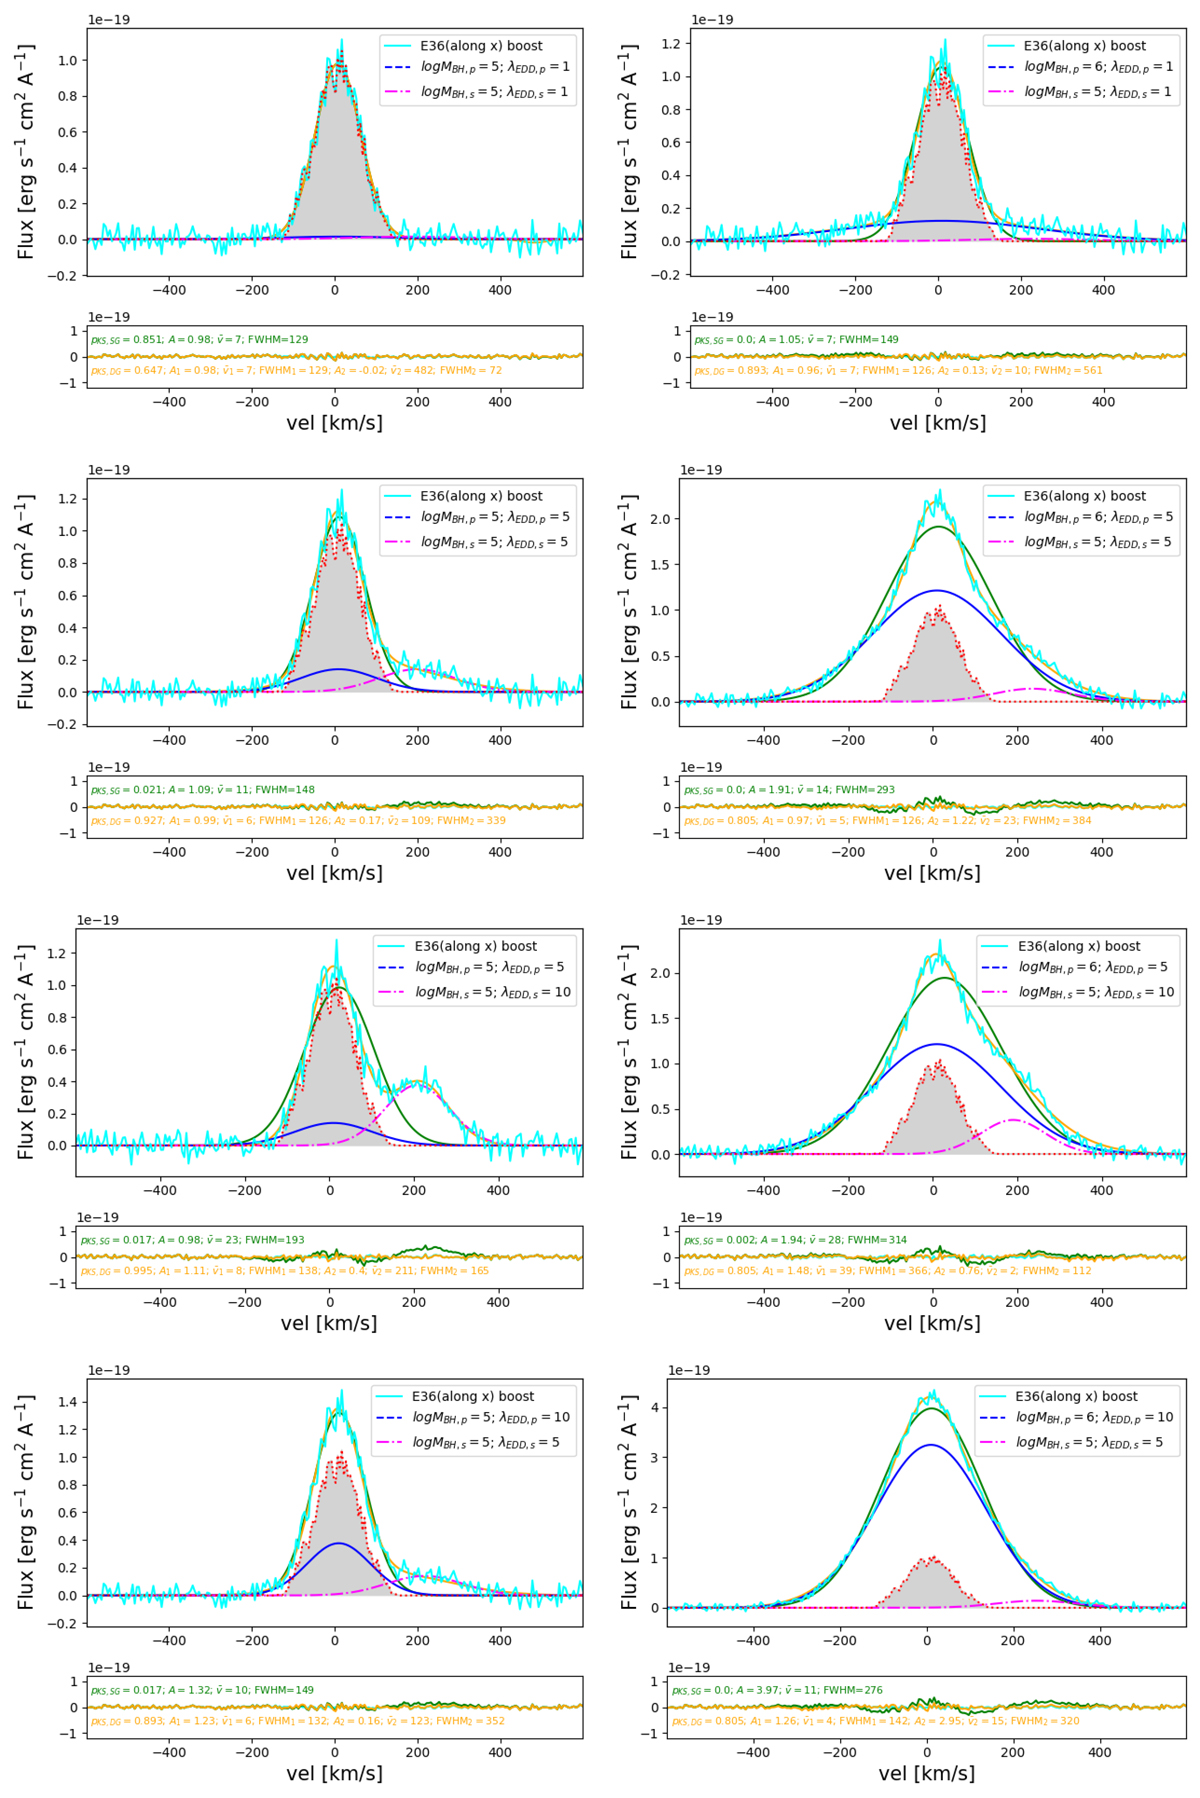
Fig. D.2.
Download original image
Re-simulated Hα profile for E36 in the LOS along the x-direction. The left column shows results for constant masses of MBHs but varying accretion rates. For the same values of the accretion rates as shown in the left column, we show the results when the primary MBH is ten times more massive than the secondary MBH. The blue (pink) dashed line represents the contribution from primary (secondary) MBH. The bottom inset in each panel refers to the added random noise in the synthetic spectrum along with the residual of the best-fitting model as explained in Sect. 5.2.
Current usage metrics show cumulative count of Article Views (full-text article views including HTML views, PDF and ePub downloads, according to the available data) and Abstracts Views on Vision4Press platform.
Data correspond to usage on the plateform after 2015. The current usage metrics is available 48-96 hours after online publication and is updated daily on week days.
Initial download of the metrics may take a while.