Fig. D.1.
Download original image
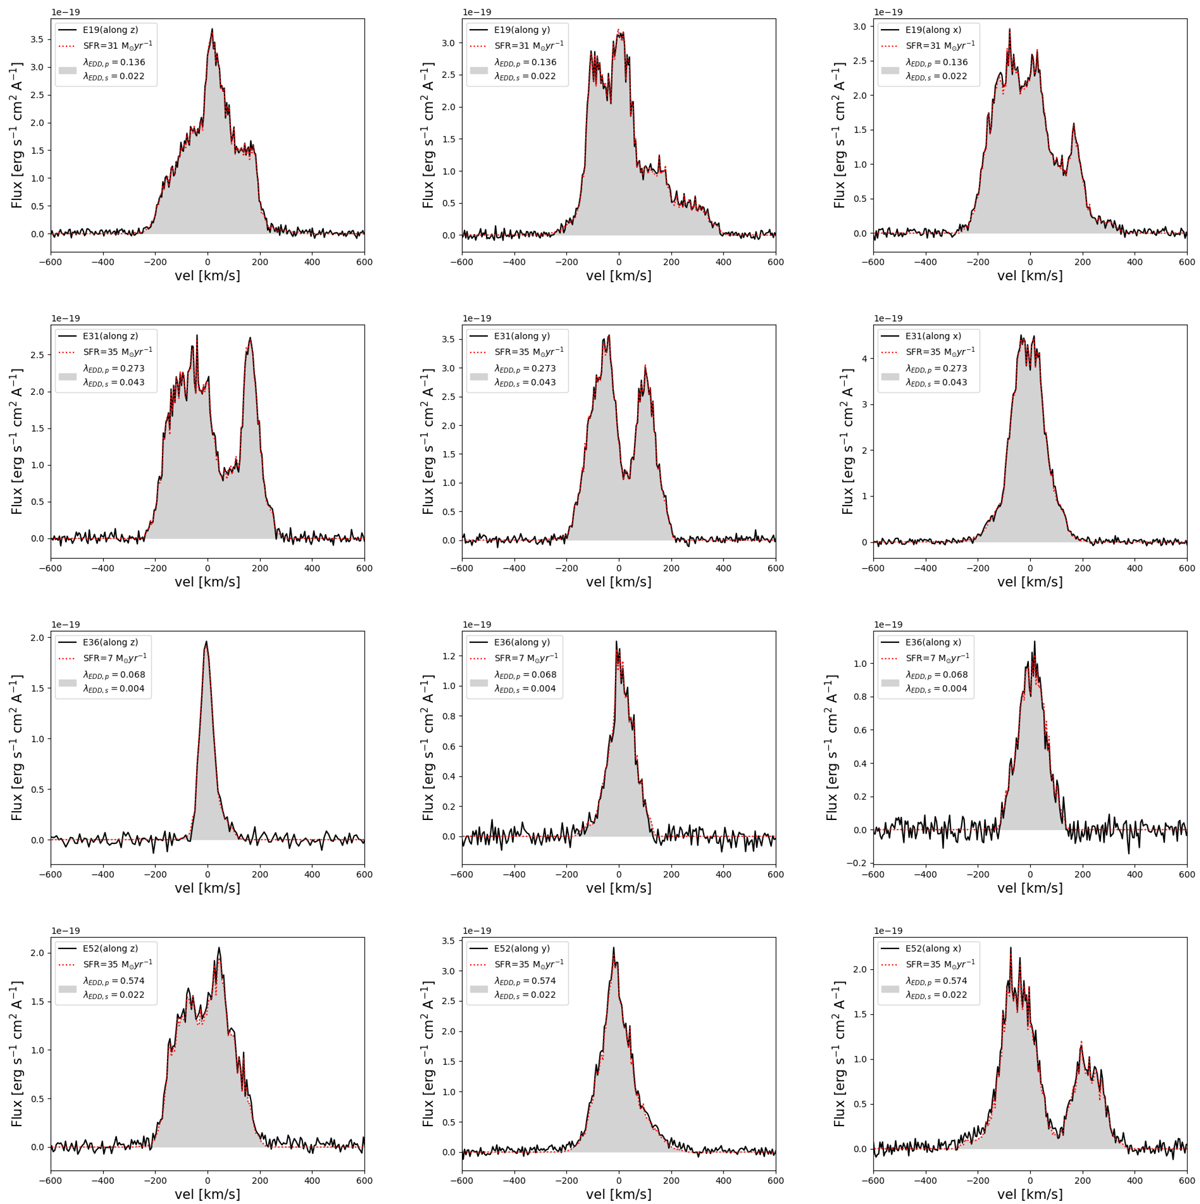
Predicted Hα line profiles from simulations for E19, E31, E36 and E52 (first, second, third, and last rows, respectively) shown along LOS in the z, y, and x (first, second and last columns, respectively) directions. The grey-shaded regions represent the calculated results. The solid black lines indicate the total flux (from SF, the accreting primary and secondary MBHs) along with the noise component and the red-dotted lines show the contribution only from SF.
Current usage metrics show cumulative count of Article Views (full-text article views including HTML views, PDF and ePub downloads, according to the available data) and Abstracts Views on Vision4Press platform.
Data correspond to usage on the plateform after 2015. The current usage metrics is available 48-96 hours after online publication and is updated daily on week days.
Initial download of the metrics may take a while.