Fig. 9
Download original image
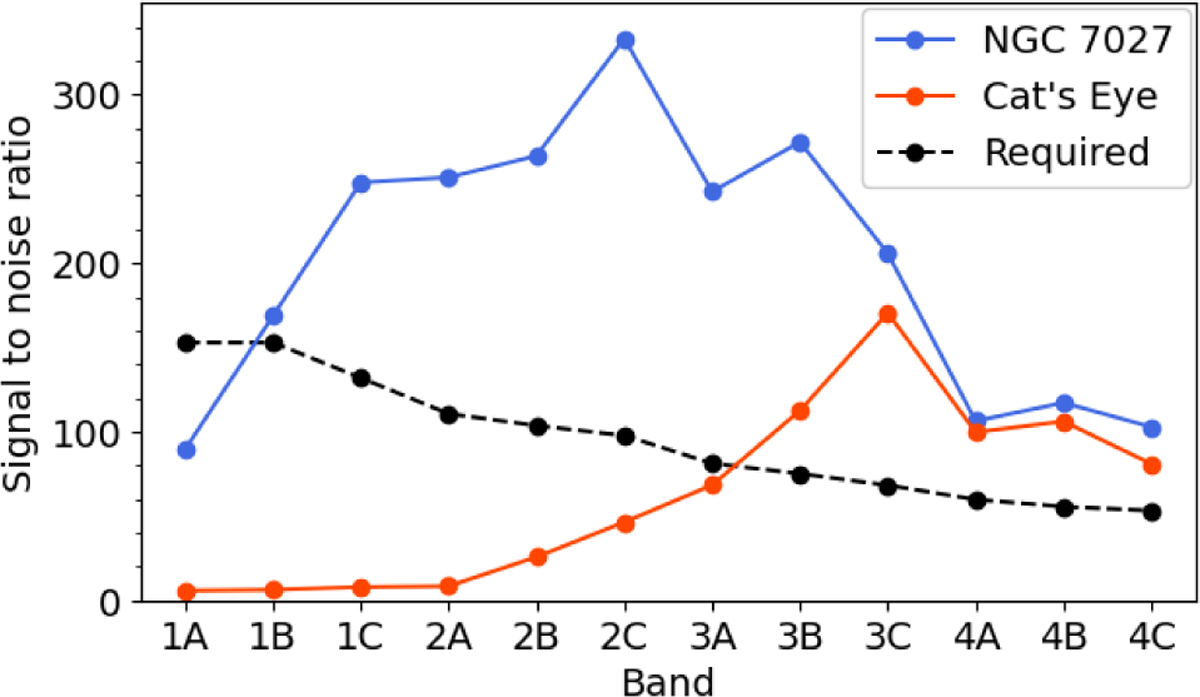
Signal-to-noise ratio of individual pixels obtained from the coadded ‘cal’ images for NGC 7027 (blue) and Cat’s Eye (red). The circles are the median S/N over each band. The S/N required to reach a fringe peak amplitude below 1% on individual spaxels for extended sources after fringe flat calibration is shown in black; this required S/N is that of the data that would be used to build the fringe flats.
Current usage metrics show cumulative count of Article Views (full-text article views including HTML views, PDF and ePub downloads, according to the available data) and Abstracts Views on Vision4Press platform.
Data correspond to usage on the plateform after 2015. The current usage metrics is available 48-96 hours after online publication and is updated daily on week days.
Initial download of the metrics may take a while.