Fig. 8
Download original image
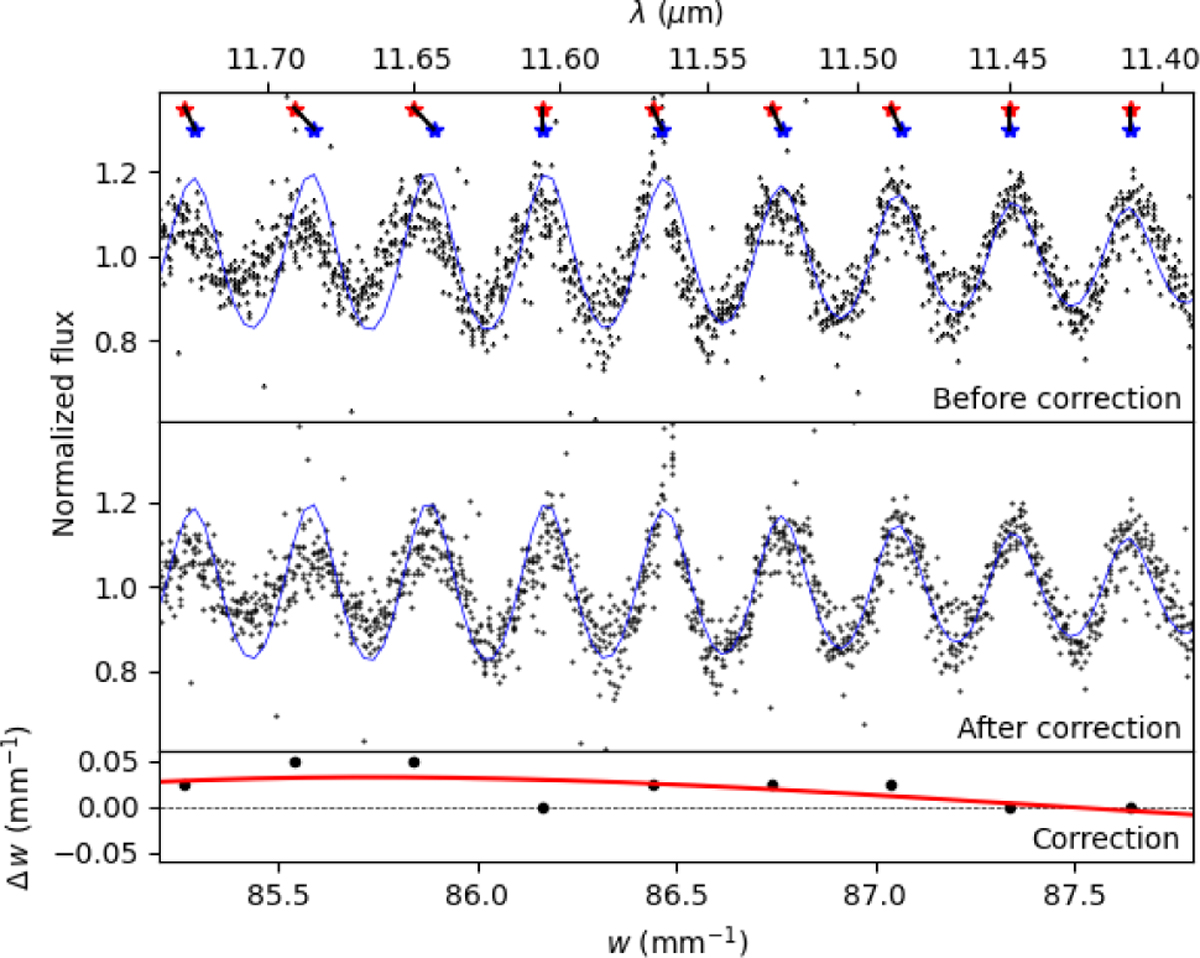
Wavelength recalibration for band 2C, slice 8, zoomed in a small wavelength region. λ is the wavelength, w is the wavenumber, and Δw is the wavenumber difference. The top panel shows the normalised flux before wavelength recalibration (black dots) and the numerical fringe model (blue line). The red and blue stars indicate the local maxima of the data and fringe model, respectively, and the black lines illustrate their shifts in wavelength. The middle panel shows the normalised flux after wavelength recalibration (black dots) and the same fringe model as in the top panel (blue line). The bottom panel shows the wavenumber differences between the local maxima of the data and of the fringe model (black points) and the spline function to model and correct for these (red line).
Current usage metrics show cumulative count of Article Views (full-text article views including HTML views, PDF and ePub downloads, according to the available data) and Abstracts Views on Vision4Press platform.
Data correspond to usage on the plateform after 2015. The current usage metrics is available 48-96 hours after online publication and is updated daily on week days.
Initial download of the metrics may take a while.