Fig. 18
Download original image
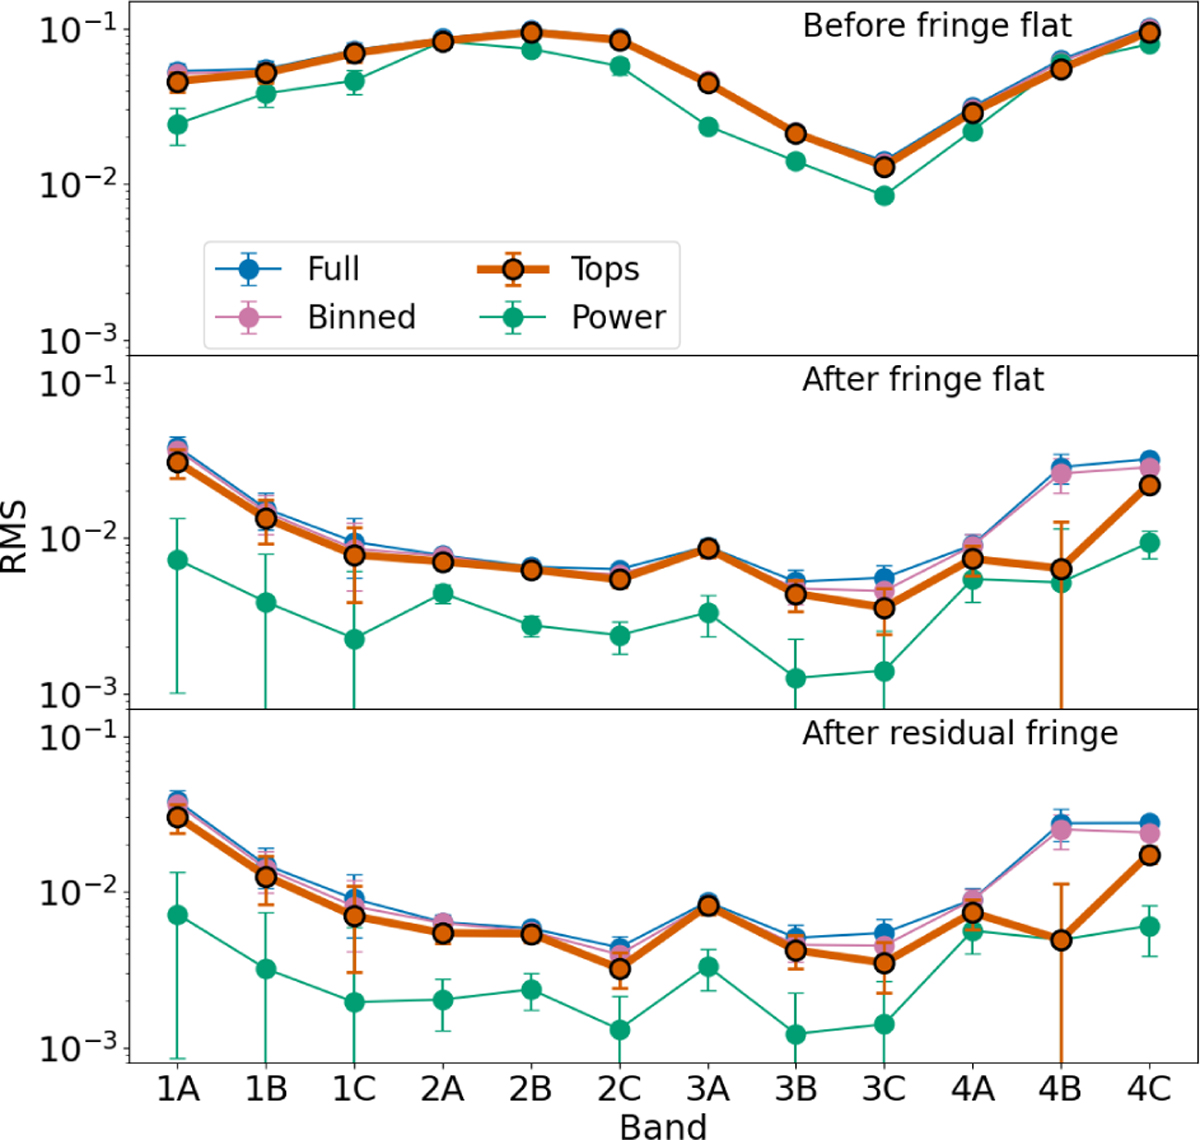
RMS for NGC 7027 for all bands before (top) and after (middle) fringe flat correction and after residual fringe correction (bottom) averaged over the 16 spaxels. The various metrics are the standard deviation of the full spectrum (blue), the standard deviation of the binned spectrum (pink), the tops RMS (orange), and the RMS derived from the main peak of the periodograms (green). The error bars indicates the dispersion of these quantities among spaxels and, for the periodograms, among the four values of N.
Current usage metrics show cumulative count of Article Views (full-text article views including HTML views, PDF and ePub downloads, according to the available data) and Abstracts Views on Vision4Press platform.
Data correspond to usage on the plateform after 2015. The current usage metrics is available 48-96 hours after online publication and is updated daily on week days.
Initial download of the metrics may take a while.