Fig. 17
Download original image
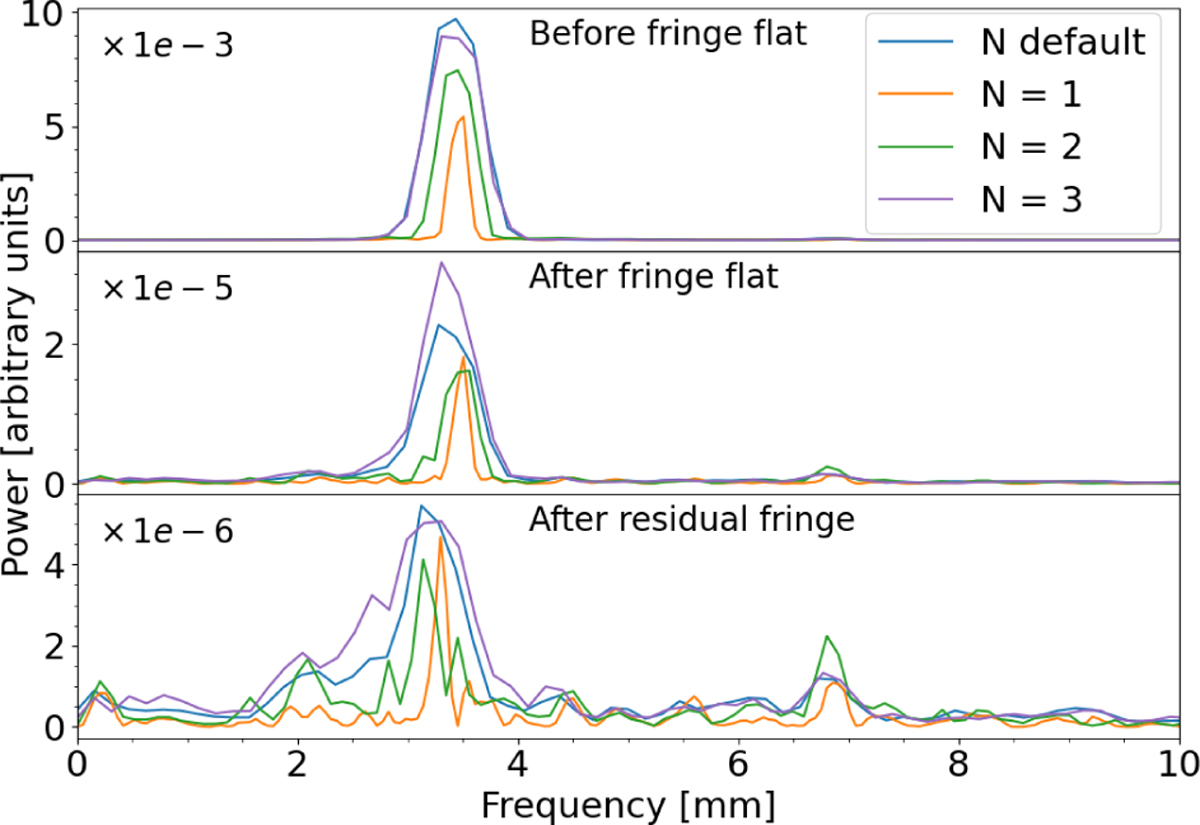
Periodograms of a spectrum of NGC 7027 before (top) and after (middle) fringe flat correction and after residual fringe correction (bottom) obtained from a single spaxel of band 2A. The frequency of the main peak matches that derived for the fringes and its amplitude decreases after applying the fringe corrections, which indicates that the fringes have been reduced. The region with frequencies between 10 and 20 mm is nearly flat and is not shown.
Current usage metrics show cumulative count of Article Views (full-text article views including HTML views, PDF and ePub downloads, according to the available data) and Abstracts Views on Vision4Press platform.
Data correspond to usage on the plateform after 2015. The current usage metrics is available 48-96 hours after online publication and is updated daily on week days.
Initial download of the metrics may take a while.