Open Access
Fig. 15
Download original image
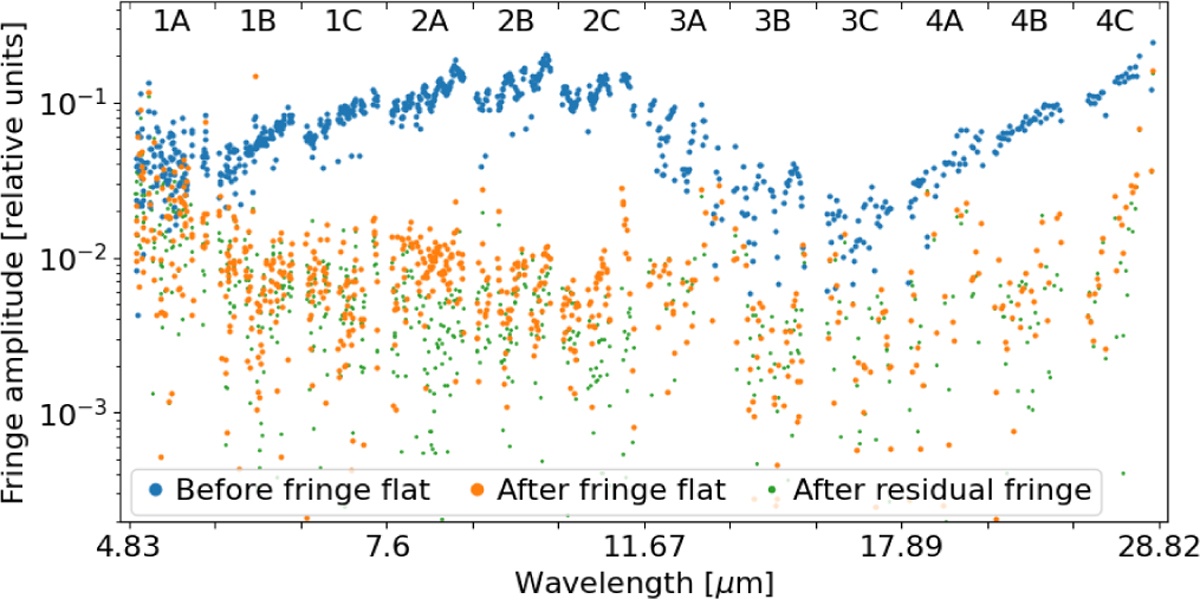
Local extrema of a spectrum of NGC 7027 before (blue) and after (orange) fringe flat correction and after 2D residual fringe correction (green) measured on a single spaxel in each band. The continuum-corrected normalised spectra have been shifted to a zero mean and the local minima have been flipped to their absolute value.
Current usage metrics show cumulative count of Article Views (full-text article views including HTML views, PDF and ePub downloads, according to the available data) and Abstracts Views on Vision4Press platform.
Data correspond to usage on the plateform after 2015. The current usage metrics is available 48-96 hours after online publication and is updated daily on week days.
Initial download of the metrics may take a while.