Open Access
Fig. 7
Download original image
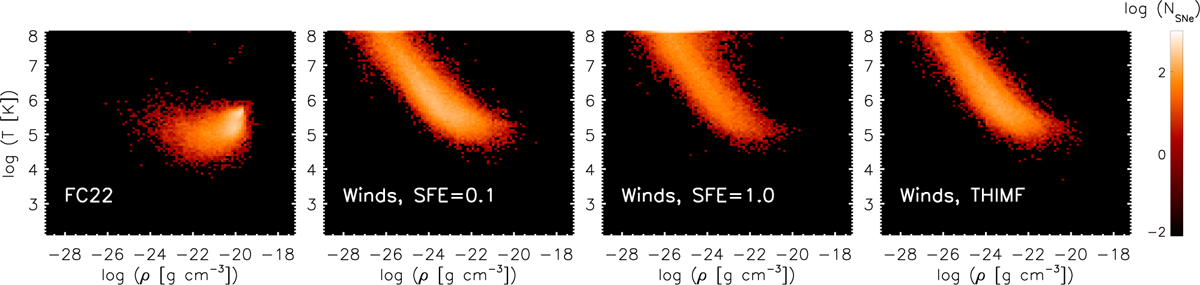
Temperature-density diagrams of the gas in which SNe explode in different models (see the text for further details) in the FC22 (first panel from left), ‘Winds, SFE=0.1’ (second), ‘Winds, SFE=1.0’ (third) and ‘Winds, THIMF’ (fourth) models. The colour scale correspods to the number of SNe exploding in each pixel of the map.
Current usage metrics show cumulative count of Article Views (full-text article views including HTML views, PDF and ePub downloads, according to the available data) and Abstracts Views on Vision4Press platform.
Data correspond to usage on the plateform after 2015. The current usage metrics is available 48-96 hours after online publication and is updated daily on week days.
Initial download of the metrics may take a while.