Fig. 6
Download original image
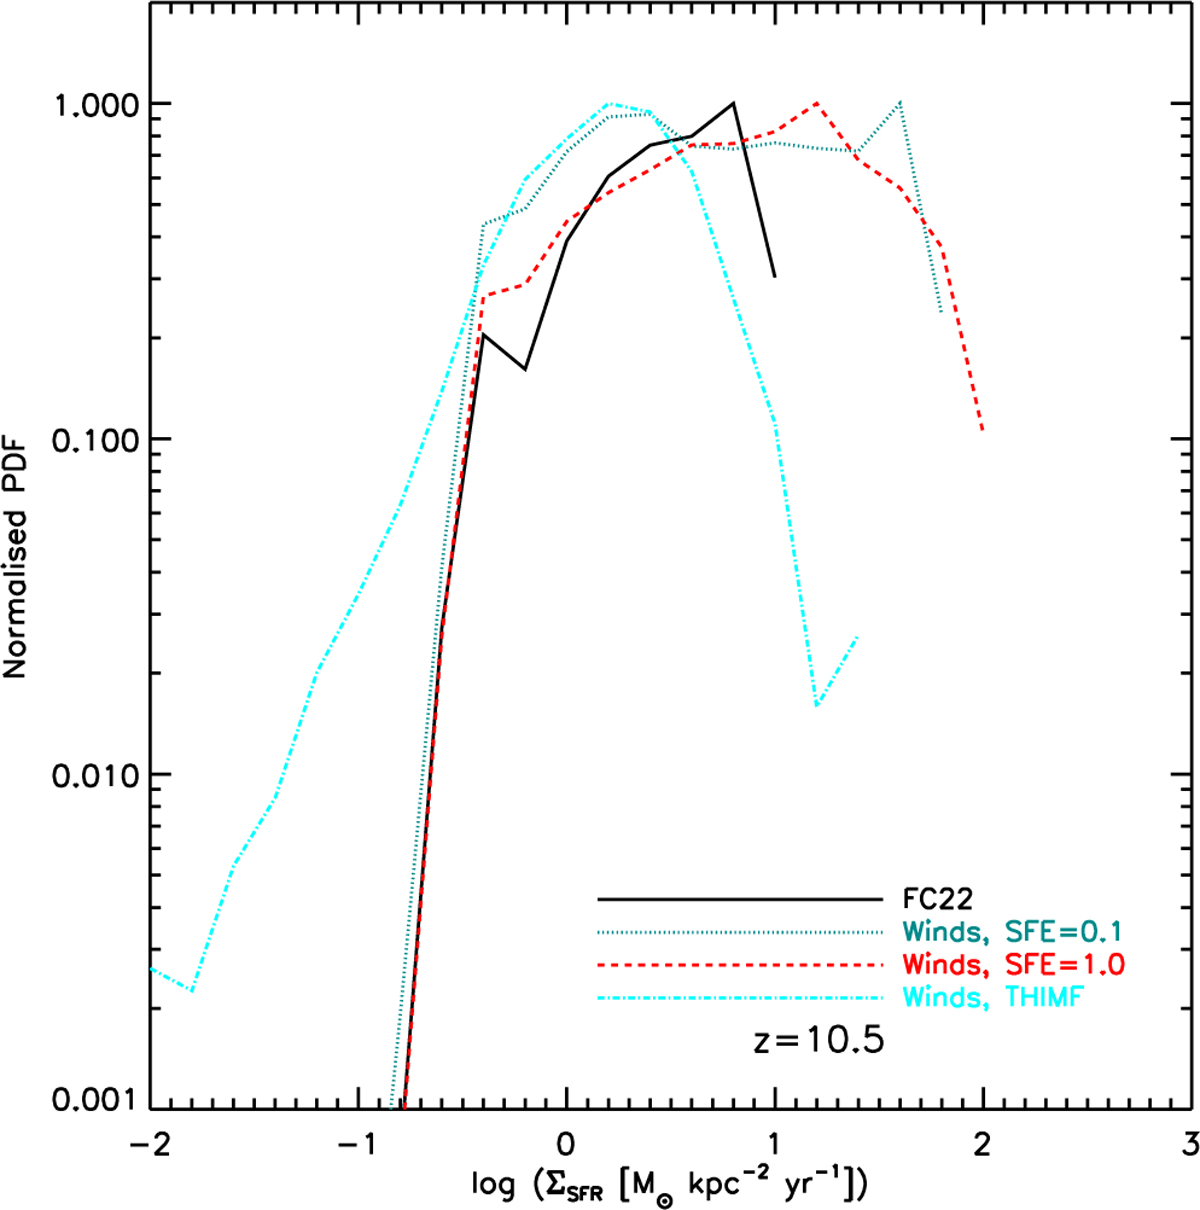
Normalised (with respect to the maximum) probability distribution function of the SFR surface density in the same central region of our simulations as in Fig. 5, at z = 10.5 and in different models. FC22: black solid line; ‘Winds, SFE=0.1’: dotted dark-cyanline; ‘Winds, SFE=1.0’: dashed red line; ‘Winds, THIMF’: dot-dashed lightcyan line.
Current usage metrics show cumulative count of Article Views (full-text article views including HTML views, PDF and ePub downloads, according to the available data) and Abstracts Views on Vision4Press platform.
Data correspond to usage on the plateform after 2015. The current usage metrics is available 48-96 hours after online publication and is updated daily on week days.
Initial download of the metrics may take a while.