Fig. 4
Download original image
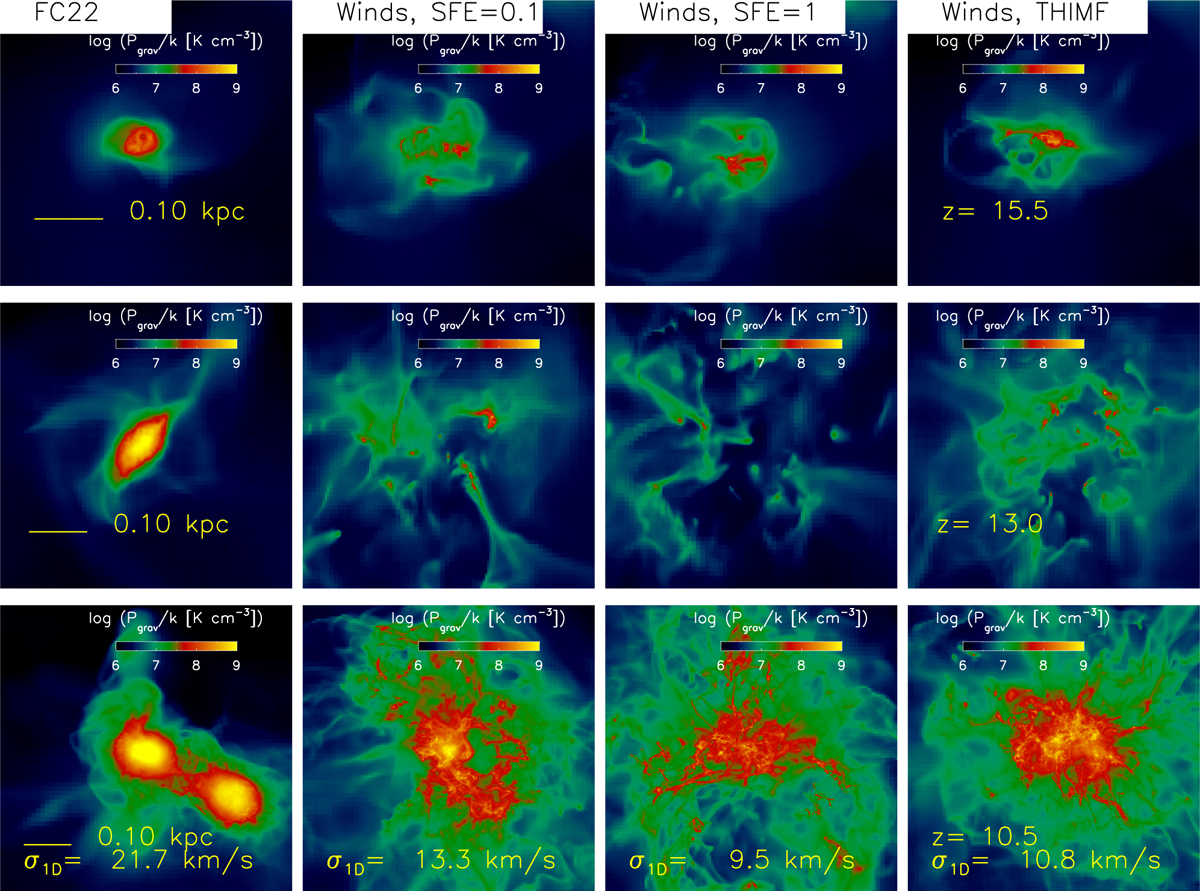
Maps of the gravitational pressure ![]() of the gas (see the text for details) in the x-y plane and in the central region of the simulations in the FC22 (first column from left), ‘Winds, SFE=0.1’ (second), ‘Winds, SFE=1.0’ (third) and ‘Winds, THIMF’ (fourth) models. The maps are at z = 15.5 (upper row), z = 13 (middle row) and z = 10.5 (bottom row). The horizontal white solid lines shown in the left-hand column-panels indicate the physical scale. In each panel we report also the 1D density-weighted velocity dispersion of the cold medium (with temperature <200 K) calculated as in Eq. (11).
of the gas (see the text for details) in the x-y plane and in the central region of the simulations in the FC22 (first column from left), ‘Winds, SFE=0.1’ (second), ‘Winds, SFE=1.0’ (third) and ‘Winds, THIMF’ (fourth) models. The maps are at z = 15.5 (upper row), z = 13 (middle row) and z = 10.5 (bottom row). The horizontal white solid lines shown in the left-hand column-panels indicate the physical scale. In each panel we report also the 1D density-weighted velocity dispersion of the cold medium (with temperature <200 K) calculated as in Eq. (11).
Current usage metrics show cumulative count of Article Views (full-text article views including HTML views, PDF and ePub downloads, according to the available data) and Abstracts Views on Vision4Press platform.
Data correspond to usage on the plateform after 2015. The current usage metrics is available 48-96 hours after online publication and is updated daily on week days.
Initial download of the metrics may take a while.