Open Access
Fig. 8.
Download original image
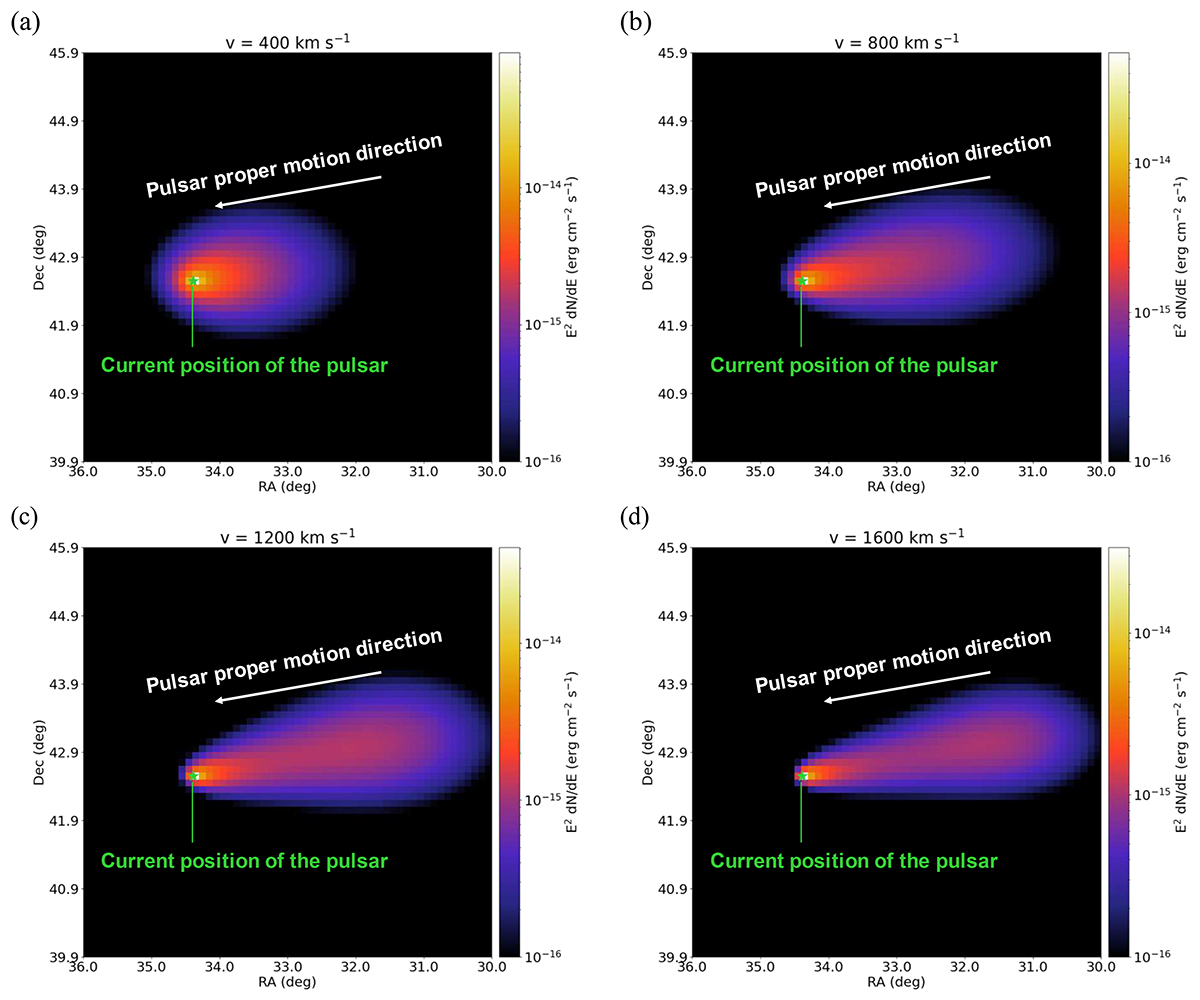
Results of γ-ray flux intensity map at 50 TeV generated for different values of v. Panels (a)–(d) give the results for v = 400 km s−1, 800 km s−1, 1200 km s−1, and 1600 km s−1, respectively. The other parameters adopted in the calculation are D0 = 4.8 × 1024 cm2 s−1 and d = 0.4 kpc.
Current usage metrics show cumulative count of Article Views (full-text article views including HTML views, PDF and ePub downloads, according to the available data) and Abstracts Views on Vision4Press platform.
Data correspond to usage on the plateform after 2015. The current usage metrics is available 48-96 hours after online publication and is updated daily on week days.
Initial download of the metrics may take a while.