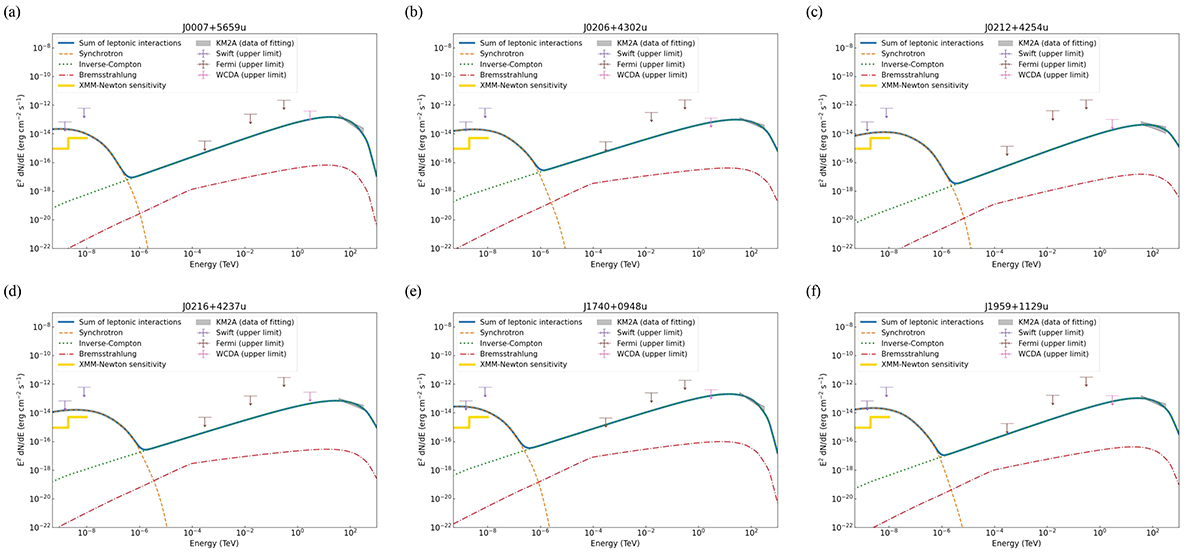
Fig. 4.
Download original image
Results of leptonic modeling research. Panel (a) shows the result of J0007+5659u. The solid blue line represents the total SED of γ-ray generated by leptonic interactions. The dashed and dotted lines in different colors are the SEDs contributed from synchrotron radiation, IC scattering, and bremsstrahlung. The pointing down arrows stand for the upper limits obtained from the observations of Swift-XRT, Fermi-LAT, and WCDA. The expected sensitivity of 3 × 10⁴ seconds’ observation with EPIC-pn of XMM-Newton has been shown by the thick golden line. The fitting SED of KM2A data with error bar is displayed by a butterfly plot filled in gray. Panels (b)–(f) are the results of J0206+4302u, J0212+4254u, J0216+4237u, J1740+0948u, and J1959+1129u, respectively.
Current usage metrics show cumulative count of Article Views (full-text article views including HTML views, PDF and ePub downloads, according to the available data) and Abstracts Views on Vision4Press platform.
Data correspond to usage on the plateform after 2015. The current usage metrics is available 48-96 hours after online publication and is updated daily on week days.
Initial download of the metrics may take a while.