Open Access
Fig. 2.
Download original image
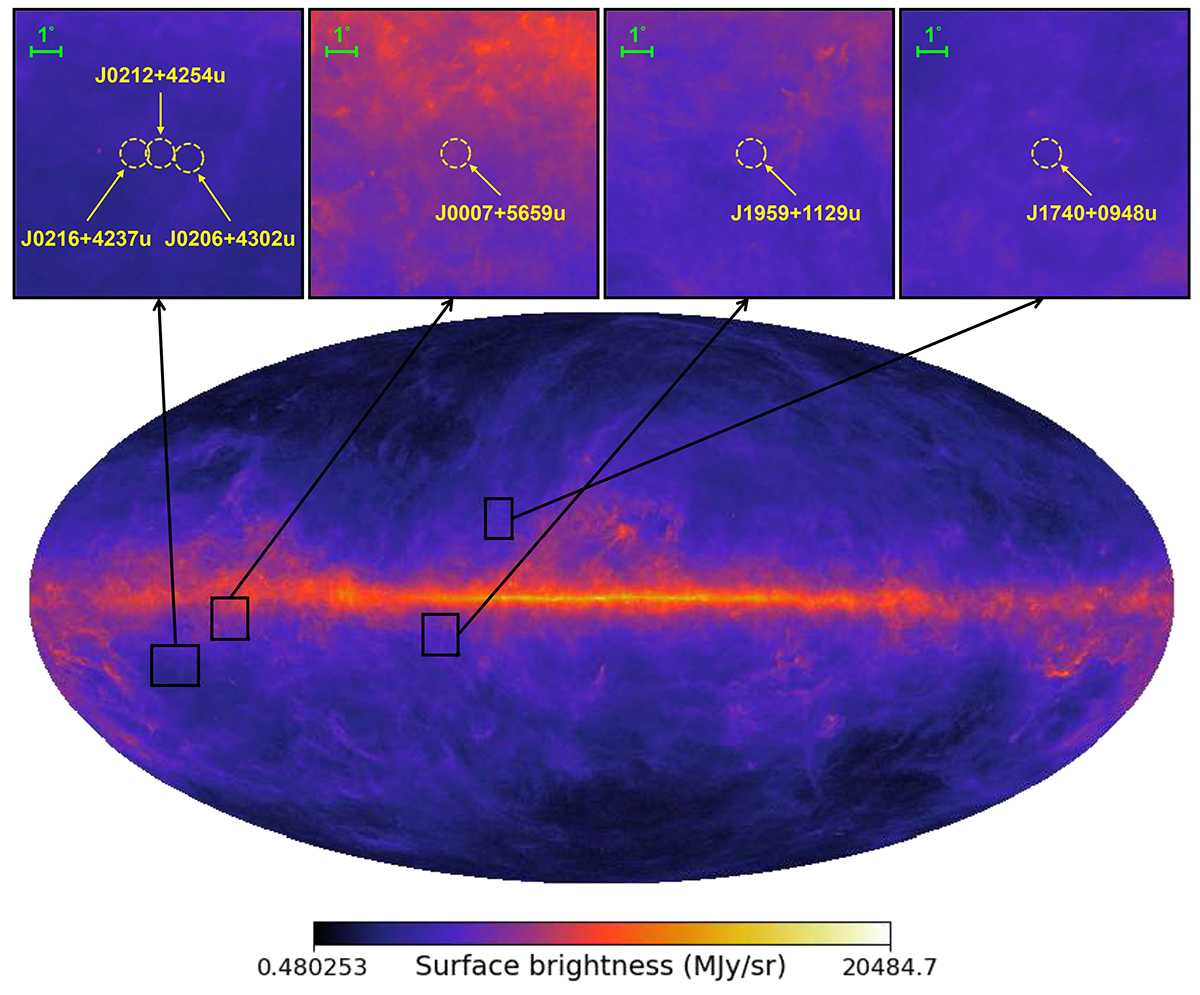
Planck all-sky map at 857 GHz. The map is presented in Galactic coordinates, and the color bar is plotted in logarithmic scale. The zoomed-in views of 10° × 10° ROIs centered on the six sources are presented at the top of the figure. The yellow dashed circles indicate the positions of labeled sources.
Current usage metrics show cumulative count of Article Views (full-text article views including HTML views, PDF and ePub downloads, according to the available data) and Abstracts Views on Vision4Press platform.
Data correspond to usage on the plateform after 2015. The current usage metrics is available 48-96 hours after online publication and is updated daily on week days.
Initial download of the metrics may take a while.