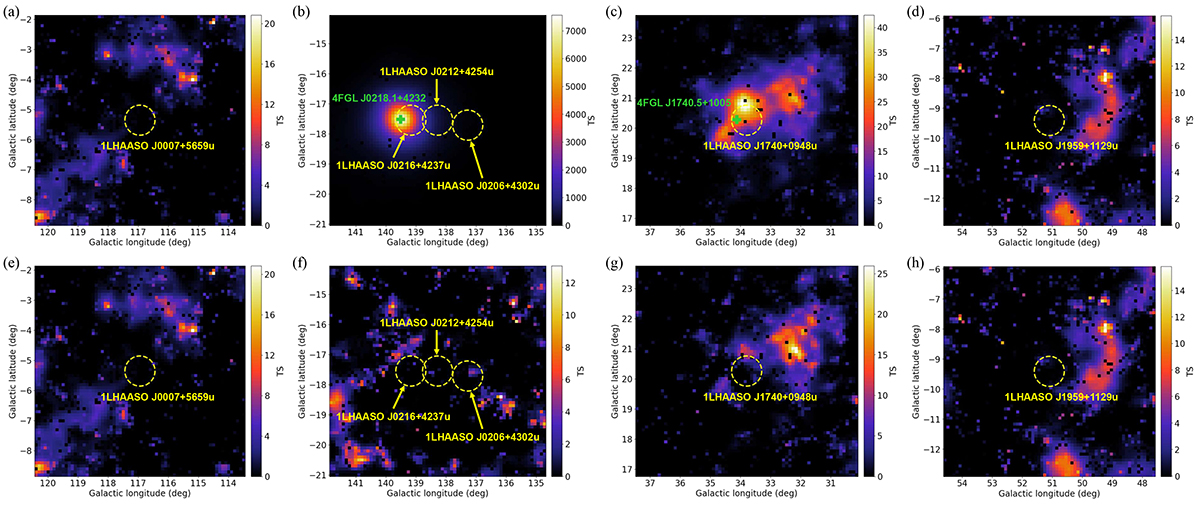
Fig. 1.
Download original image
Fermi TS maps within the 5° radius ROIs around the six LHAASO UHE sources. Panels (a)–(d) show TS maps where the nearby 4FGL sources associated with the LHAASO sources are retained. Yellow dashed circles with a radius of 0![]() 5 are centered on the labeled LHAASO sources and indicate the regions used to filter the 4FGL sources by position. Panels (e)–(h) display the residual TS maps after excluding all 4FGL sources.
5 are centered on the labeled LHAASO sources and indicate the regions used to filter the 4FGL sources by position. Panels (e)–(h) display the residual TS maps after excluding all 4FGL sources.
Current usage metrics show cumulative count of Article Views (full-text article views including HTML views, PDF and ePub downloads, according to the available data) and Abstracts Views on Vision4Press platform.
Data correspond to usage on the plateform after 2015. The current usage metrics is available 48-96 hours after online publication and is updated daily on week days.
Initial download of the metrics may take a while.