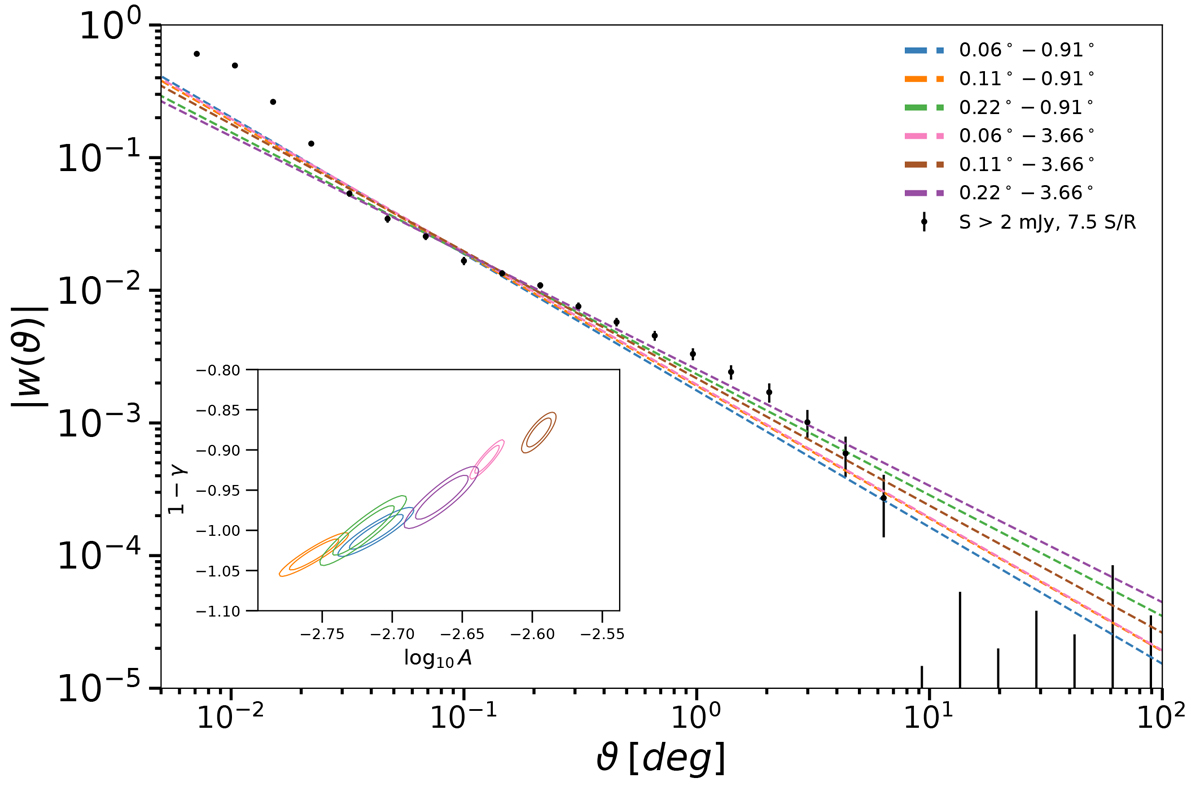
Fig. 9.
Download original image
Fitting results for power laws to different angular ranges at 2 mJy flux-density threshold and S/N 7.5. (dashed lines). The dots represent the results of direct measurements of the two-point correlation function using the Landy-Szalay estimator. The inner plot shows the 1σ and 2σ contours for amplitude and exponent of the power-law fit to w(ϑ).
Current usage metrics show cumulative count of Article Views (full-text article views including HTML views, PDF and ePub downloads, according to the available data) and Abstracts Views on Vision4Press platform.
Data correspond to usage on the plateform after 2015. The current usage metrics is available 48-96 hours after online publication and is updated daily on week days.
Initial download of the metrics may take a while.