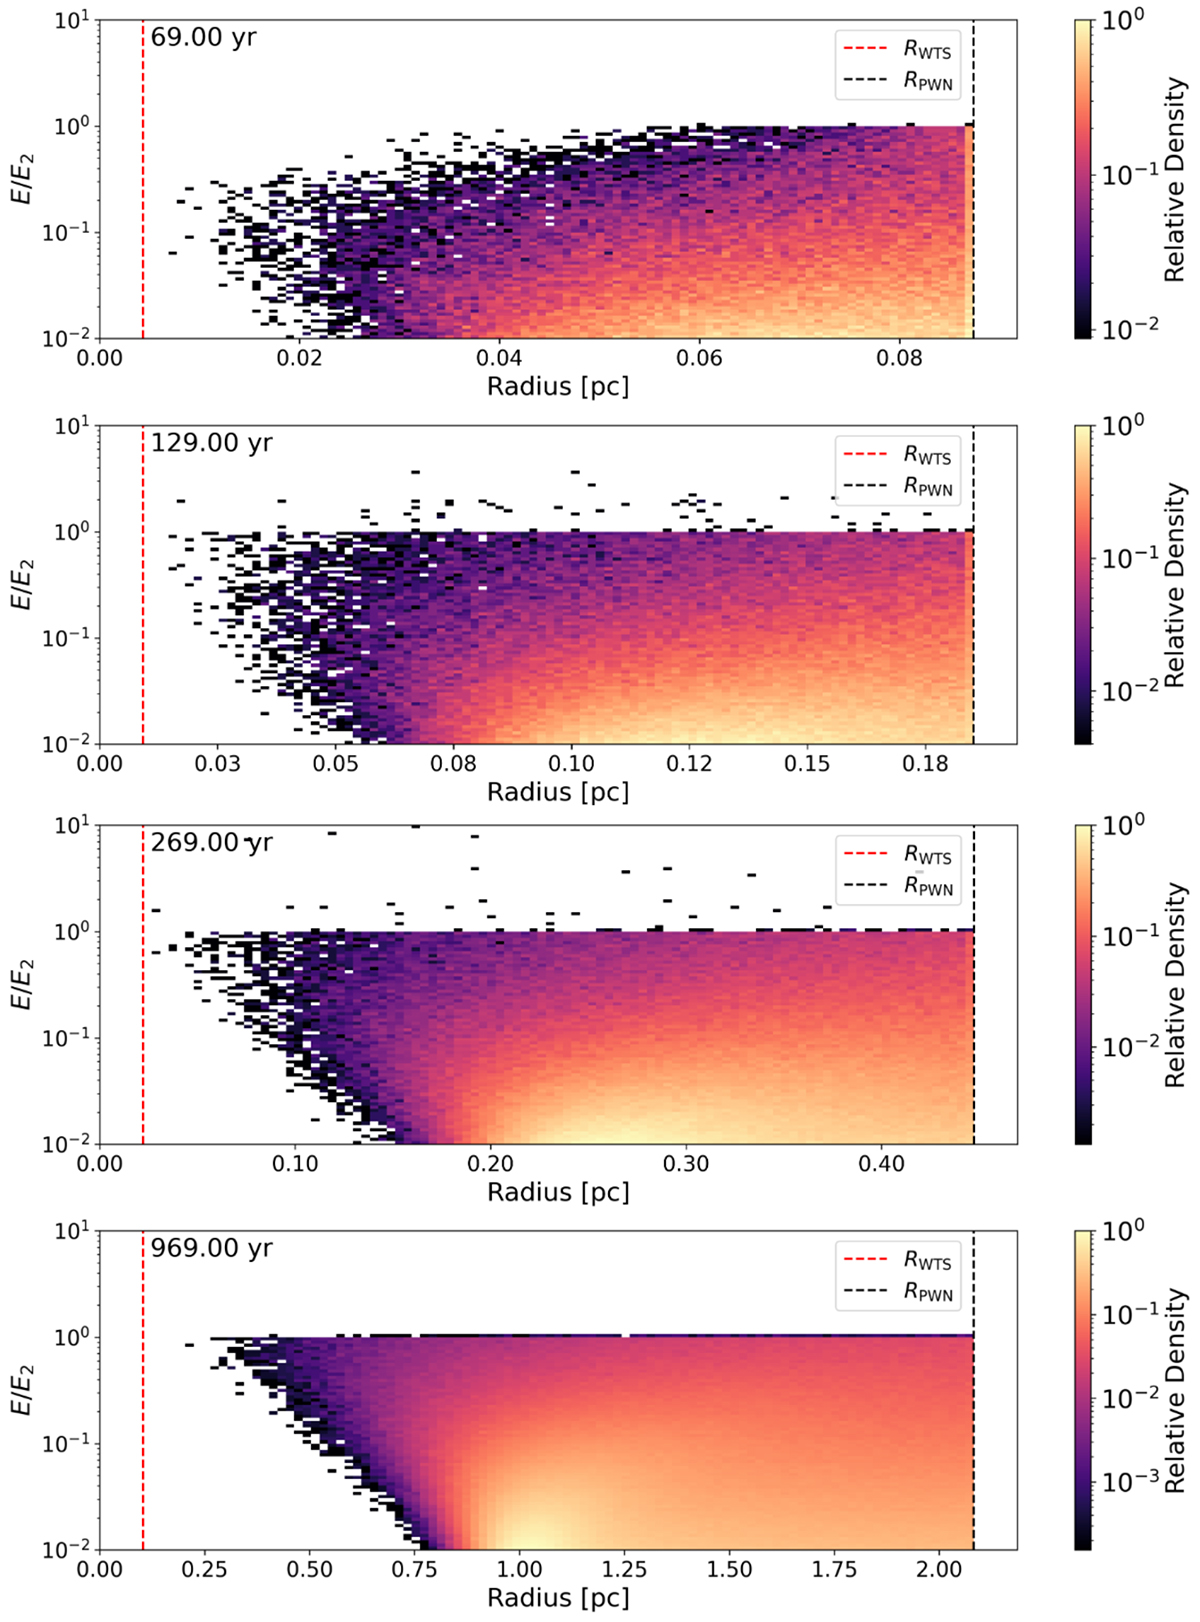
Fig. 3.
Download original image
Instantaneous steps of the simulation over time. At each time step, the distribution of particle energies compared to the maximum injection particle energy is shown as a function of distance from the pulsar. A small number of particles with energy ratios greater than one can be seen, corresponding to interactions with the WTS. The PWN radius was constrained to reach the current size at the end of the simulation (969 years). At late times (≳650 years), there are no interactions with the WTS, and very few shocked particles remain within the nebula.
Current usage metrics show cumulative count of Article Views (full-text article views including HTML views, PDF and ePub downloads, according to the available data) and Abstracts Views on Vision4Press platform.
Data correspond to usage on the plateform after 2015. The current usage metrics is available 48-96 hours after online publication and is updated daily on week days.
Initial download of the metrics may take a while.