Fig. 7
Download original image
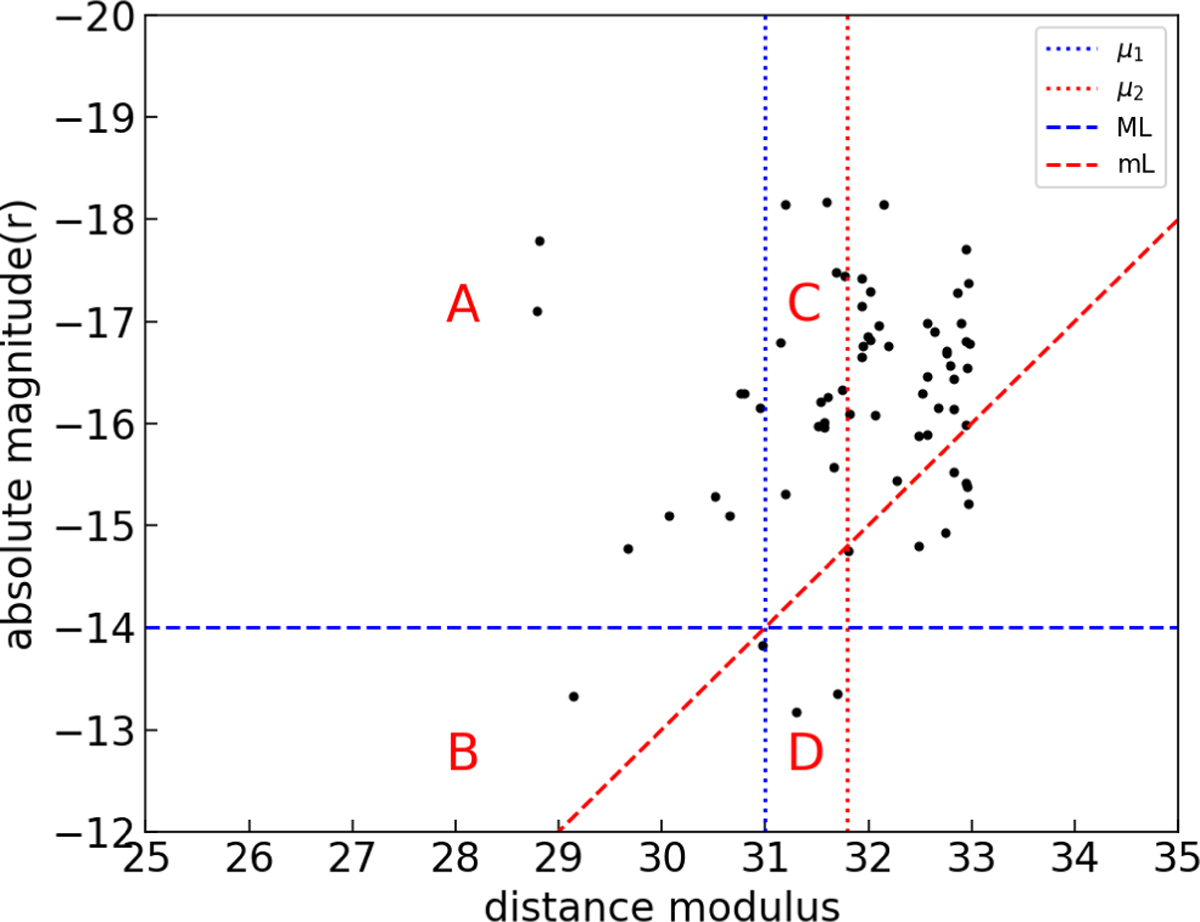
Miller diagram for our SN IIP sample. The diagonal line is mL, while the horizontal line is ML. The two vertical lines at different distance modulus separate the volume within μ2 into a sphere and a concentric spherical shell. A, B, C and D represent the four regions of the volume within μ2 separated by the ML and the μ = μ1 lines.
Current usage metrics show cumulative count of Article Views (full-text article views including HTML views, PDF and ePub downloads, according to the available data) and Abstracts Views on Vision4Press platform.
Data correspond to usage on the plateform after 2015. The current usage metrics is available 48-96 hours after online publication and is updated daily on week days.
Initial download of the metrics may take a while.