Open Access
Fig. 11
Download original image
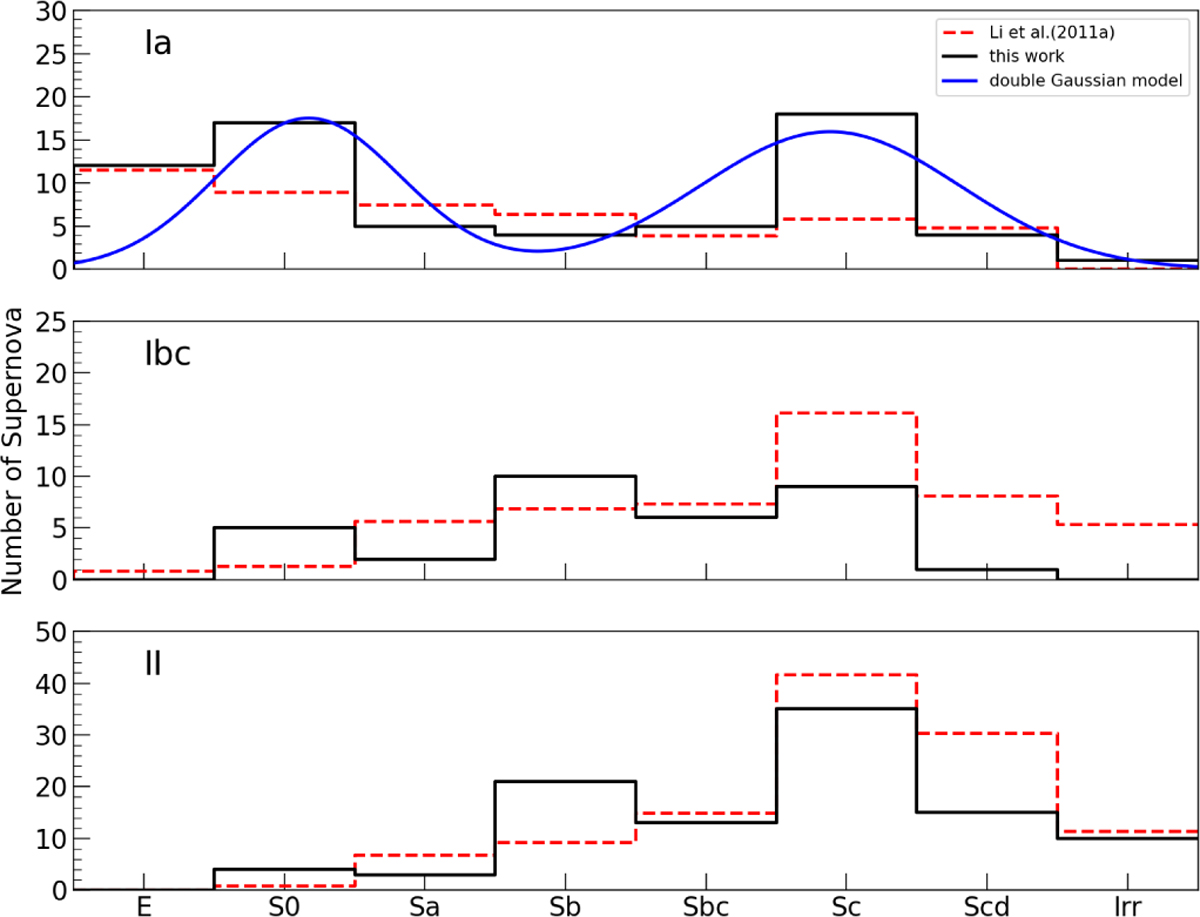
Hubble-type distribution of our SN host sample compared to that of the Lick sample (Li et al. 2011b). The solid black lines are for our SN sample, while the dashed red lines are interpolated from the Li et al. (2011b) sample. The blue line in the upper panel represents the double Gaussian fit to the SN Ia distribution.
Current usage metrics show cumulative count of Article Views (full-text article views including HTML views, PDF and ePub downloads, according to the available data) and Abstracts Views on Vision4Press platform.
Data correspond to usage on the plateform after 2015. The current usage metrics is available 48-96 hours after online publication and is updated daily on week days.
Initial download of the metrics may take a while.