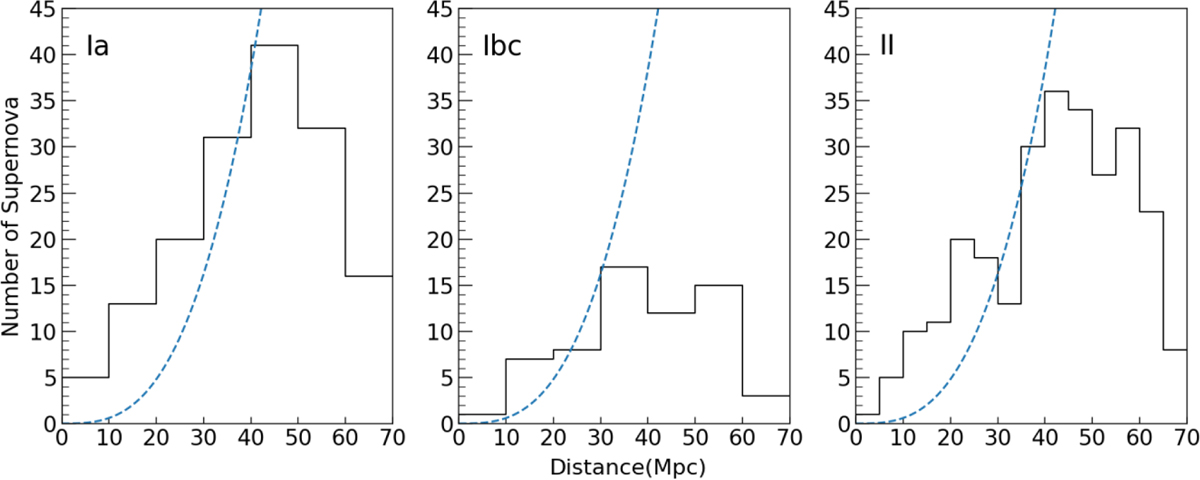
Fig. 1
Download original image
Number distribution of our SN sample as a function of distance for Ia (left), Ibc (middle), and II (right) samples, respectively. We adjust the distance bin from 10 Mpc to 5 Mpc for SNe II because its sample size at around 40 Mpc is rather large for this type. The dashed lines represent the expected number distribution of SNe ∝ d3.
Current usage metrics show cumulative count of Article Views (full-text article views including HTML views, PDF and ePub downloads, according to the available data) and Abstracts Views on Vision4Press platform.
Data correspond to usage on the plateform after 2015. The current usage metrics is available 48-96 hours after online publication and is updated daily on week days.
Initial download of the metrics may take a while.