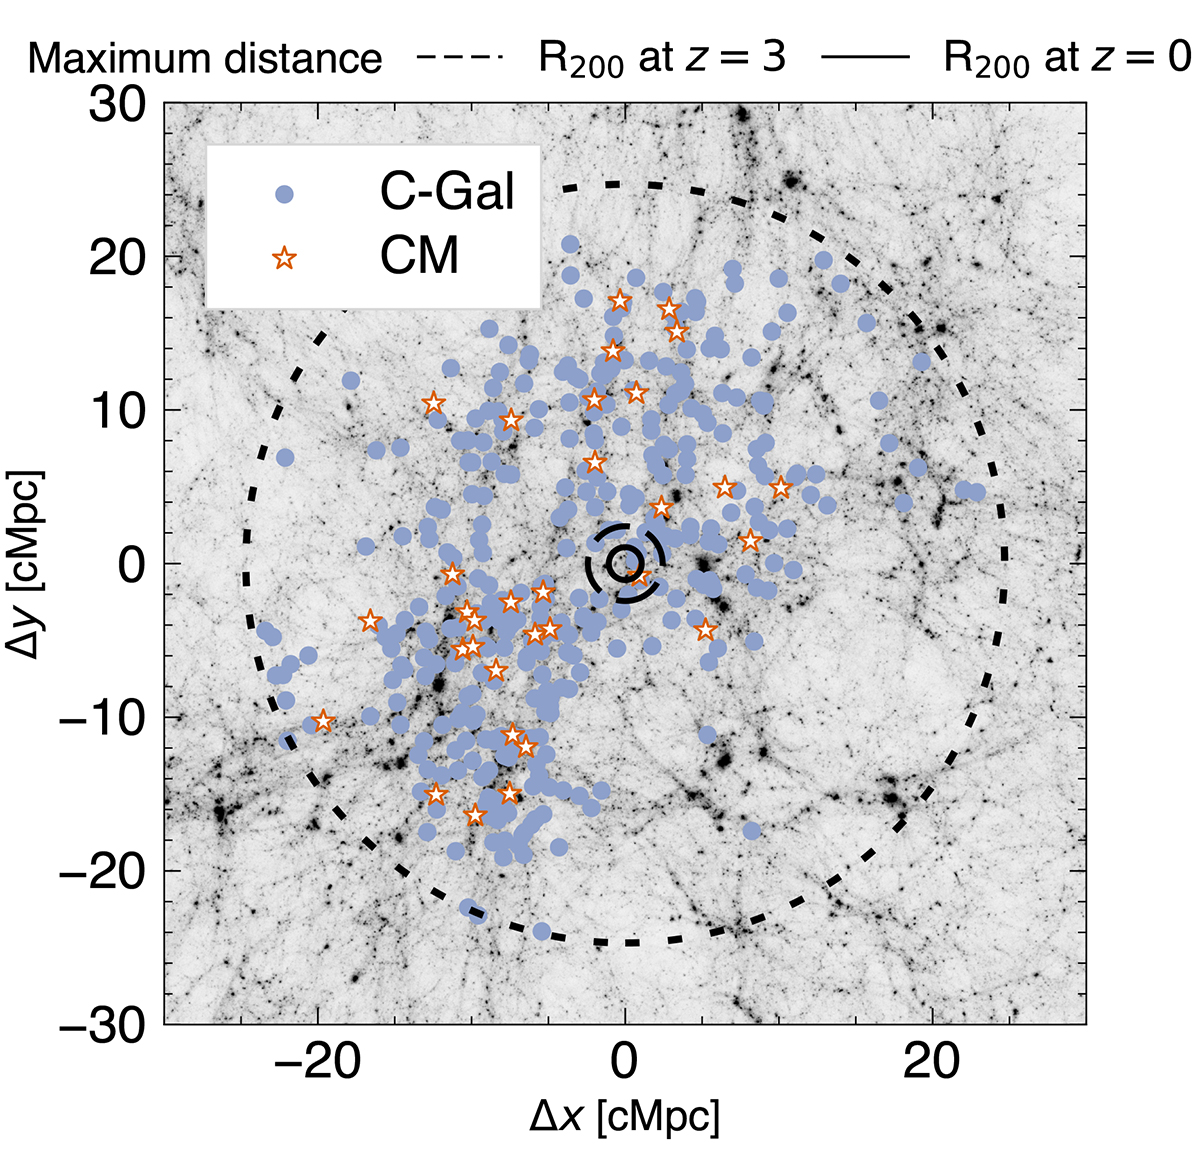
Fig. 7.
Download original image
Spatial distribution of galaxies at z = 3 around the most massive cluster in TNG300 (Group 0, see Table 1, same as Figure 1). Orange stars show the cluster member (CM) galaxies that underwent a recent major merger – defined as a mass ratio of 1:n (n≤4) – in the last 200 Myr while blue circles indicate those that did not (C-Gal). The dark matter distribution at the thickness of 60 cMpc is shown in the background. The black circles are the same shown in Figure 1, indicating the farthest galaxy position, R200 at z = 3, and R200 at z = 0.
Current usage metrics show cumulative count of Article Views (full-text article views including HTML views, PDF and ePub downloads, according to the available data) and Abstracts Views on Vision4Press platform.
Data correspond to usage on the plateform after 2015. The current usage metrics is available 48-96 hours after online publication and is updated daily on week days.
Initial download of the metrics may take a while.