Fig. 13.
Download original image
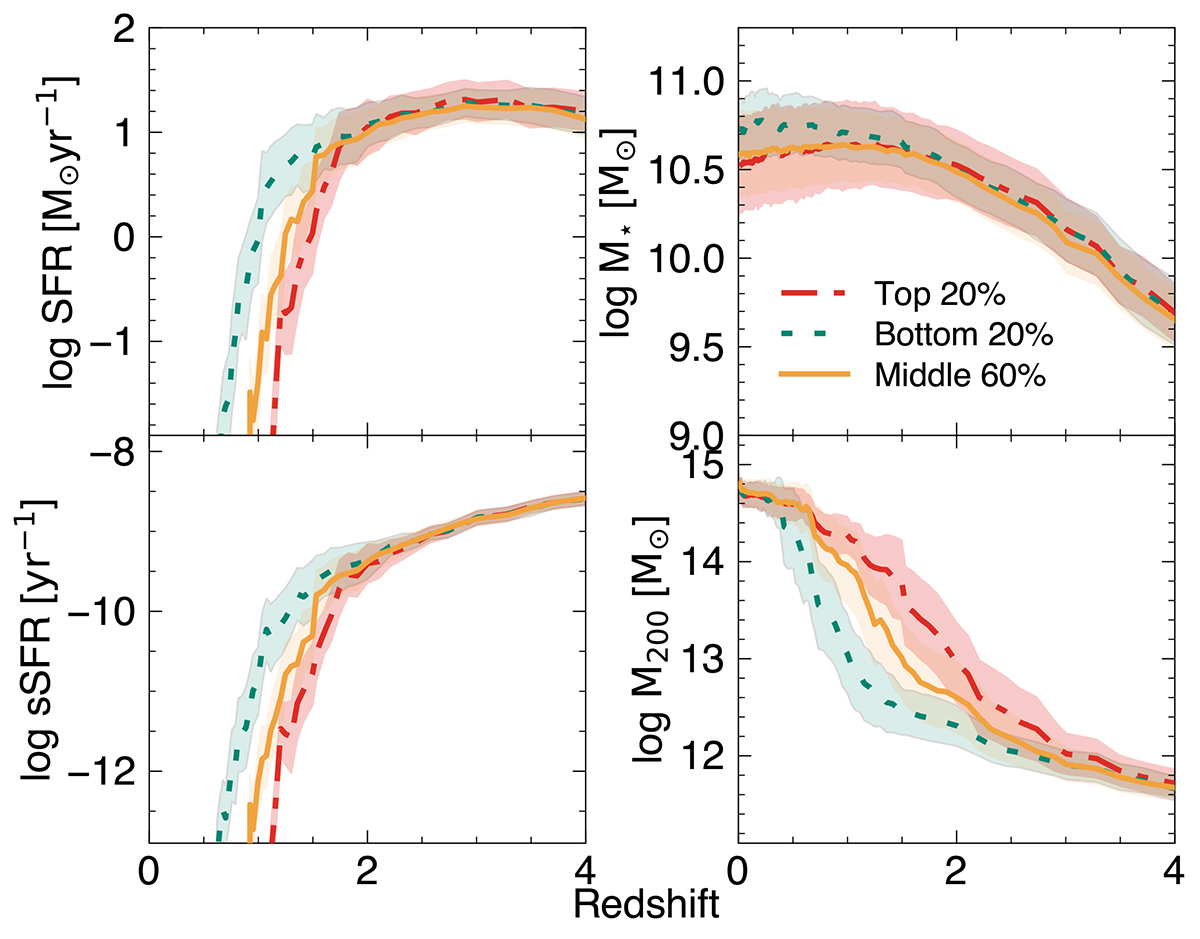
Cosmic evolution of SFR, M★, sSFR, and M200 of TNG300 galaxies are compared for C-LAEs split by environmental density δ5. The C-LAEs in the top 20% densest regions are shown in red (dot-dashed line), the middle 60% are shown in orange (solid line), and the bottom 20% are shown in blue (dotted line). The averages and standard deviation are computed the same as for Figure 9.
Current usage metrics show cumulative count of Article Views (full-text article views including HTML views, PDF and ePub downloads, according to the available data) and Abstracts Views on Vision4Press platform.
Data correspond to usage on the plateform after 2015. The current usage metrics is available 48-96 hours after online publication and is updated daily on week days.
Initial download of the metrics may take a while.