Fig. 12.
Download original image
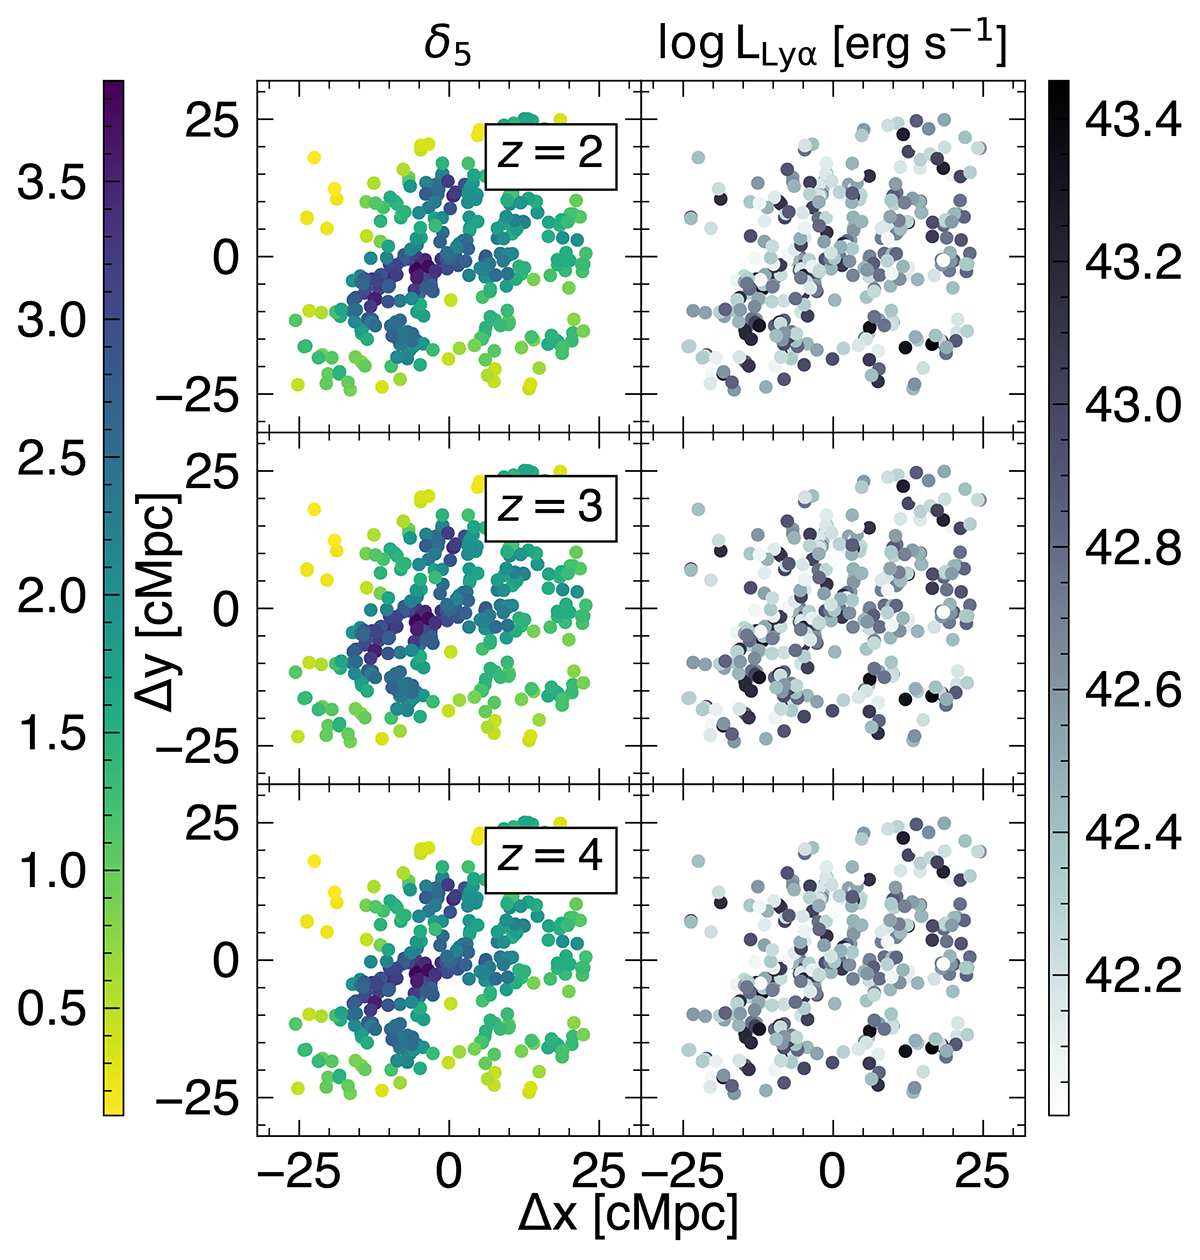
Spatial distribution of LAEs in the XY- plane for the region centered in the most massive cluster selected at z = 0 from TNG300, and traced through z = 2 (top), 3 (middle), and 4 (bottom). The left panels display the LAE positions colored by environmental density δ5 while the right panels show the same positions colored by the Lyman α luminosity.
Current usage metrics show cumulative count of Article Views (full-text article views including HTML views, PDF and ePub downloads, according to the available data) and Abstracts Views on Vision4Press platform.
Data correspond to usage on the plateform after 2015. The current usage metrics is available 48-96 hours after online publication and is updated daily on week days.
Initial download of the metrics may take a while.