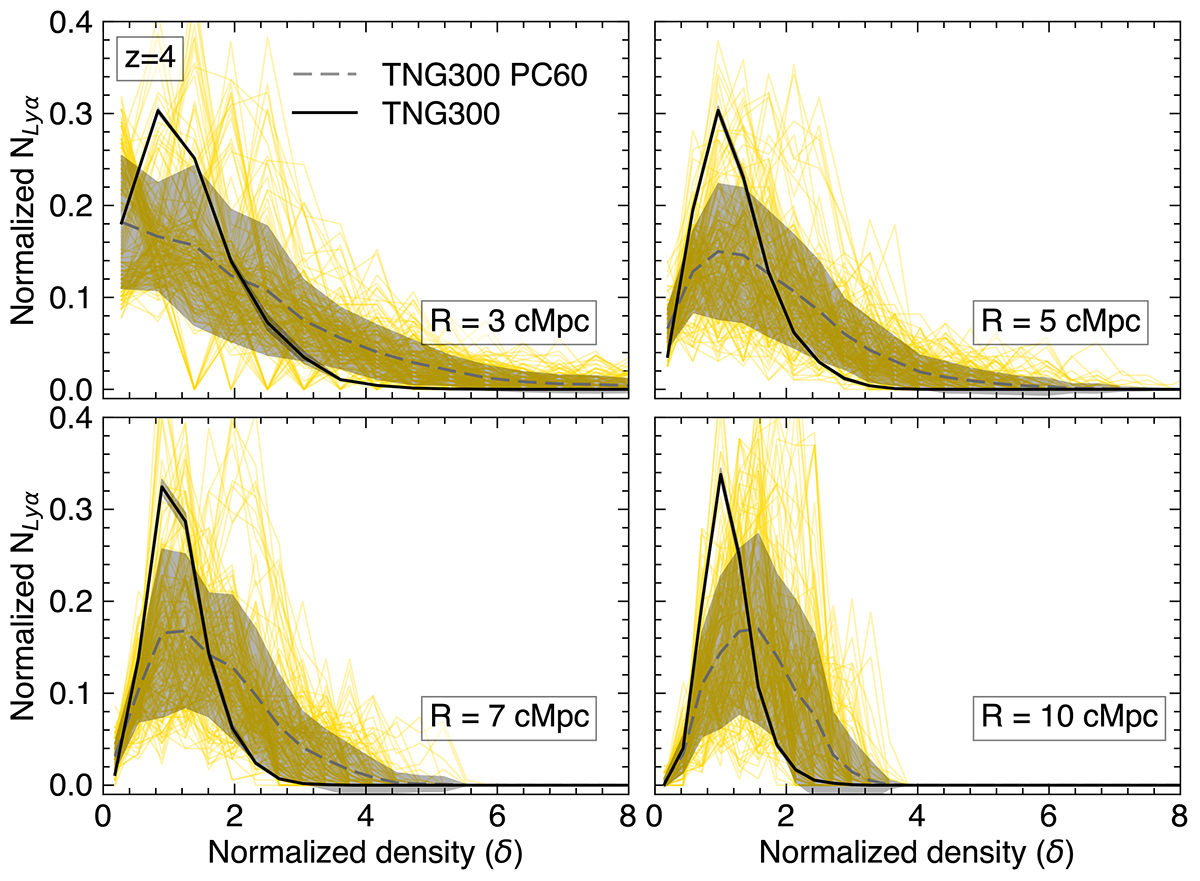
Fig. 11.
Download original image
Distribution of the large-scale environment of the LAEs from TNG300 at z = 4. Each panel shows the results for a different radius r = 3,5,7, and 10 cMpc (from top left to bottom right). We include the mean value for the TNG Full box (solid black line), the results obtained for each PC box (solid yellow faint lines), and their average distribution (gray dashed lines).
Current usage metrics show cumulative count of Article Views (full-text article views including HTML views, PDF and ePub downloads, according to the available data) and Abstracts Views on Vision4Press platform.
Data correspond to usage on the plateform after 2015. The current usage metrics is available 48-96 hours after online publication and is updated daily on week days.
Initial download of the metrics may take a while.