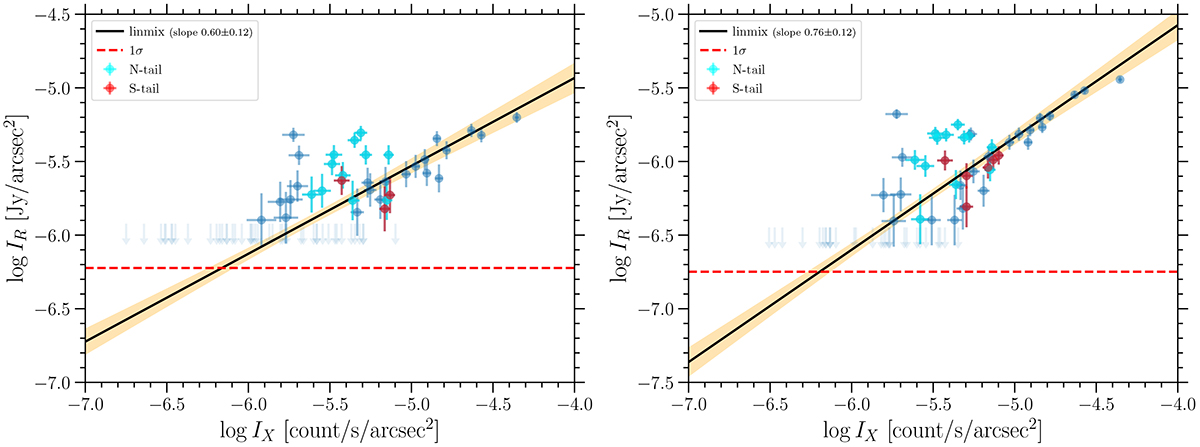
Fig. 8.
Download original image
Left: Radio surface brightness (IR) vs. X-ray surface brightness (IX) for band 3. The points in these plots are from the grid shown in Figure B.1. The cyan points are from the northern X-ray tail, the red points are from the southern X-ray tail, and the remaining points are from the rest of the halo. The fit to the points is shown as a solid black line, and the 95% confidence region is shown in the shaded part. The dashed red line shows the 1σ level of the radio images. The light blue arrows indicate the upper limits above 2σrms points. Right:IR vs. IX scaling plot for band 4 in the same color-code as in the left panel.
Current usage metrics show cumulative count of Article Views (full-text article views including HTML views, PDF and ePub downloads, according to the available data) and Abstracts Views on Vision4Press platform.
Data correspond to usage on the plateform after 2015. The current usage metrics is available 48-96 hours after online publication and is updated daily on week days.
Initial download of the metrics may take a while.