Fig. 6.
Download original image
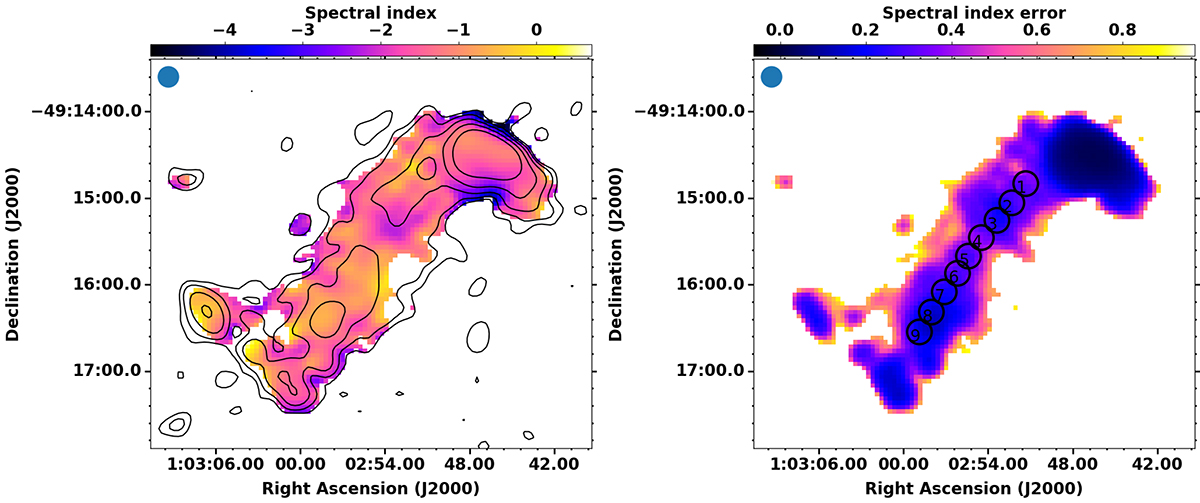
Left: Spectral index map between 366 MHz and 672 MHz for the radio halo in El-Gordo at 15″ × 15″ resolution in color scale. The contours from the 672 MHz image at 0.1, 0.2, 0.4, 0.8, and 1.6 mJy beam−1 are overlaid. Right: Spectral index error map. High errors at the edges are expected due to the low S/N at the outskirts. The numbered regions used for analysis are shown in the map. The beam is shown in the top left corner in both panels.
Current usage metrics show cumulative count of Article Views (full-text article views including HTML views, PDF and ePub downloads, according to the available data) and Abstracts Views on Vision4Press platform.
Data correspond to usage on the plateform after 2015. The current usage metrics is available 48-96 hours after online publication and is updated daily on week days.
Initial download of the metrics may take a while.