Open Access
Fig. 5.
Download original image
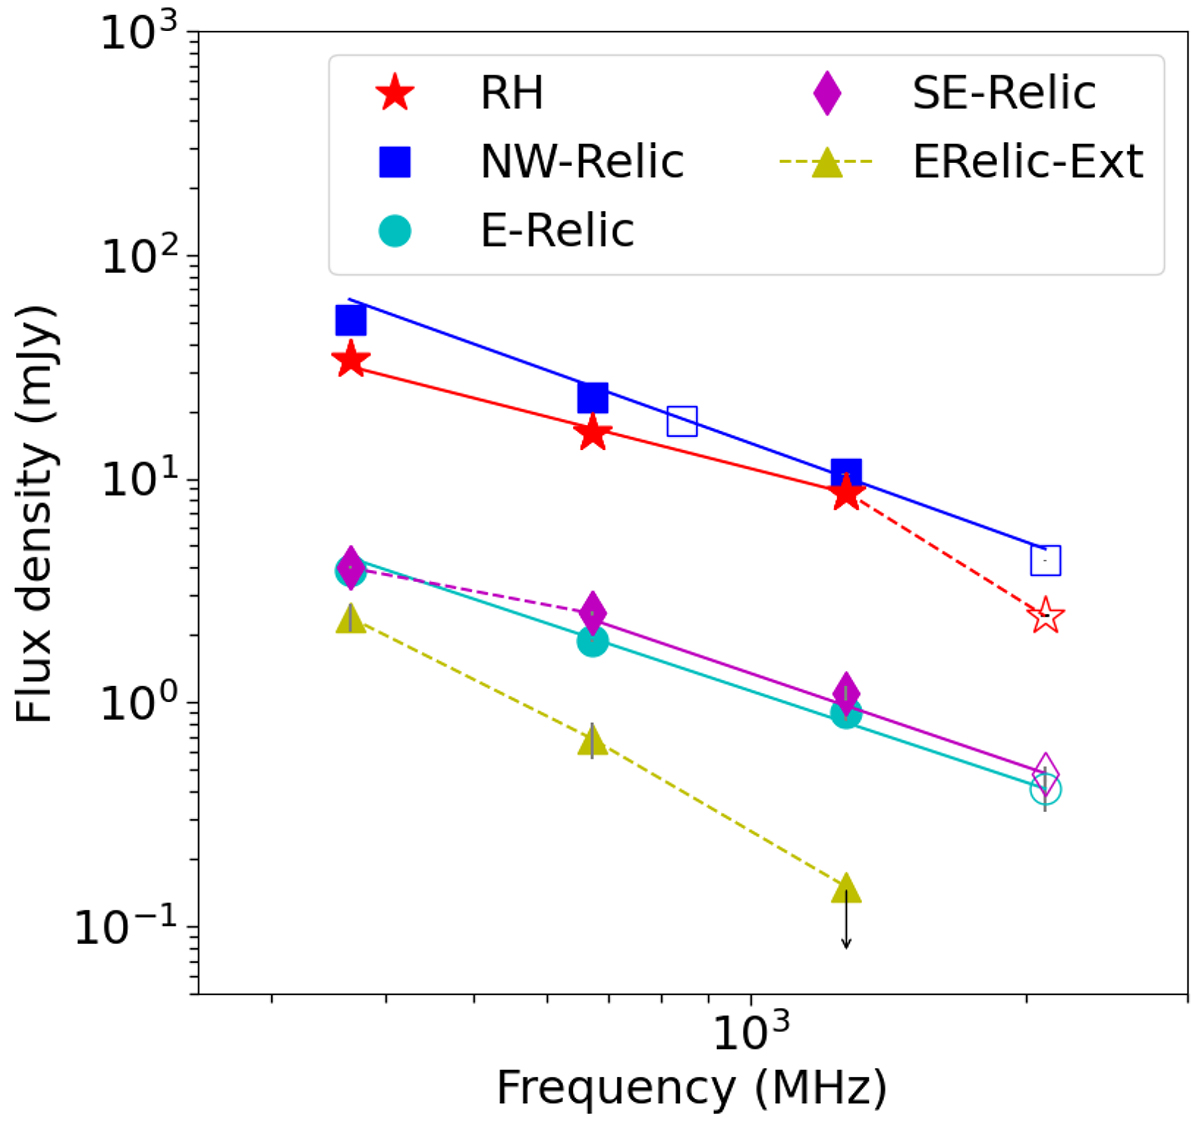
Integrated spectra of the diffuse sources in El Gordo. The open symbols show the points from L14. The solid lines show the power-law fits. The spectral indices are reported in Table 3. The dashed lines join the points for the respective diffuse components that were not included in the fits.
Current usage metrics show cumulative count of Article Views (full-text article views including HTML views, PDF and ePub downloads, according to the available data) and Abstracts Views on Vision4Press platform.
Data correspond to usage on the plateform after 2015. The current usage metrics is available 48-96 hours after online publication and is updated daily on week days.
Initial download of the metrics may take a while.