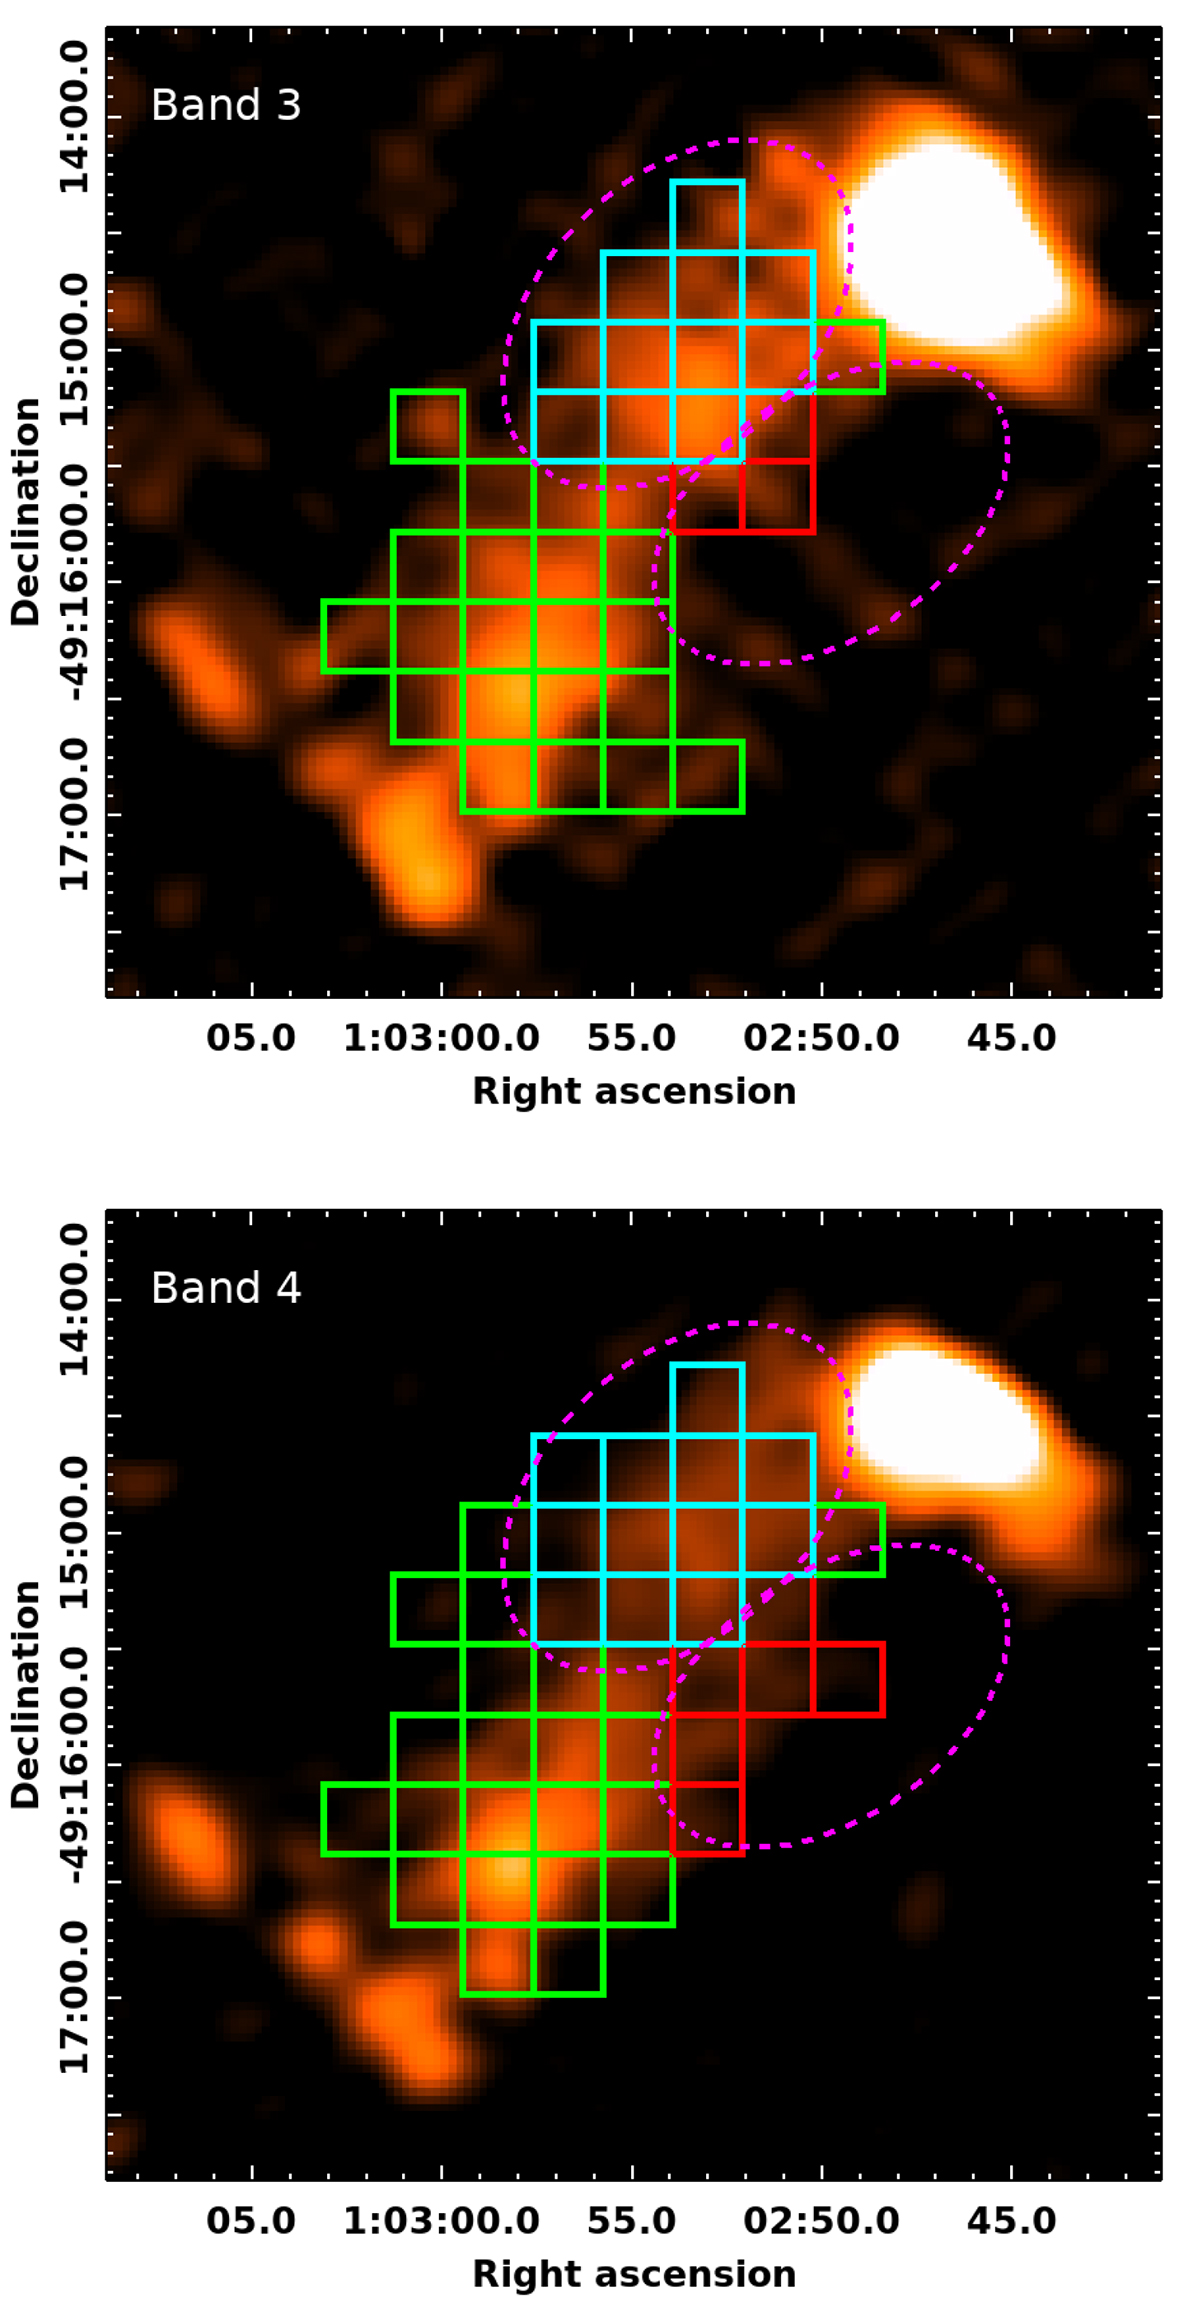
Fig. B.1.
Download original image
The two panels show the band 3 (top) and band 4 (bottom) images used in the spectral and point-to-point analysis. The two ellipses in magenta (dashed line) mark the two tails in X-rays. The regions of the grid within the two tails are color coded (cyan in the northern tail and red in the southern tail) in the point-to-point analysis. The rest of the regions are shown in green.
Current usage metrics show cumulative count of Article Views (full-text article views including HTML views, PDF and ePub downloads, according to the available data) and Abstracts Views on Vision4Press platform.
Data correspond to usage on the plateform after 2015. The current usage metrics is available 48-96 hours after online publication and is updated daily on week days.
Initial download of the metrics may take a while.