Fig. 11.
Download original image
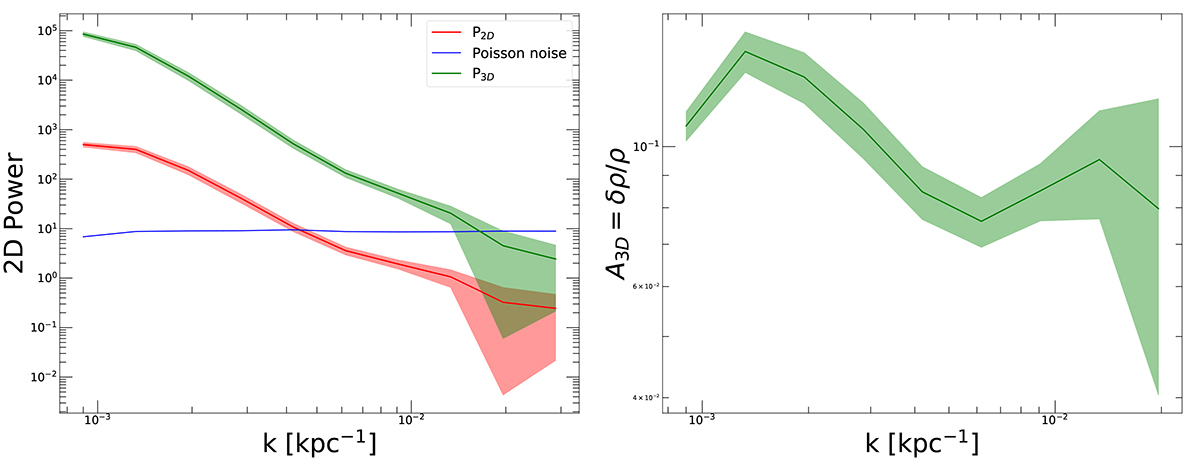
Left: Fluctuation power spectrum in the central 1 Mpc of El Gordo, where the bullet is masked, as a function of wave number k. The red curve shows the 2D fluctuations in the power spectrum subtracted from the Poisson noise (blue curve). The green curve shows the corresponding deprojected 3D power spectrum. Right: Amplitude of 3D fluctuations ![]() as a function of wave number.
as a function of wave number.
Current usage metrics show cumulative count of Article Views (full-text article views including HTML views, PDF and ePub downloads, according to the available data) and Abstracts Views on Vision4Press platform.
Data correspond to usage on the plateform after 2015. The current usage metrics is available 48-96 hours after online publication and is updated daily on week days.
Initial download of the metrics may take a while.