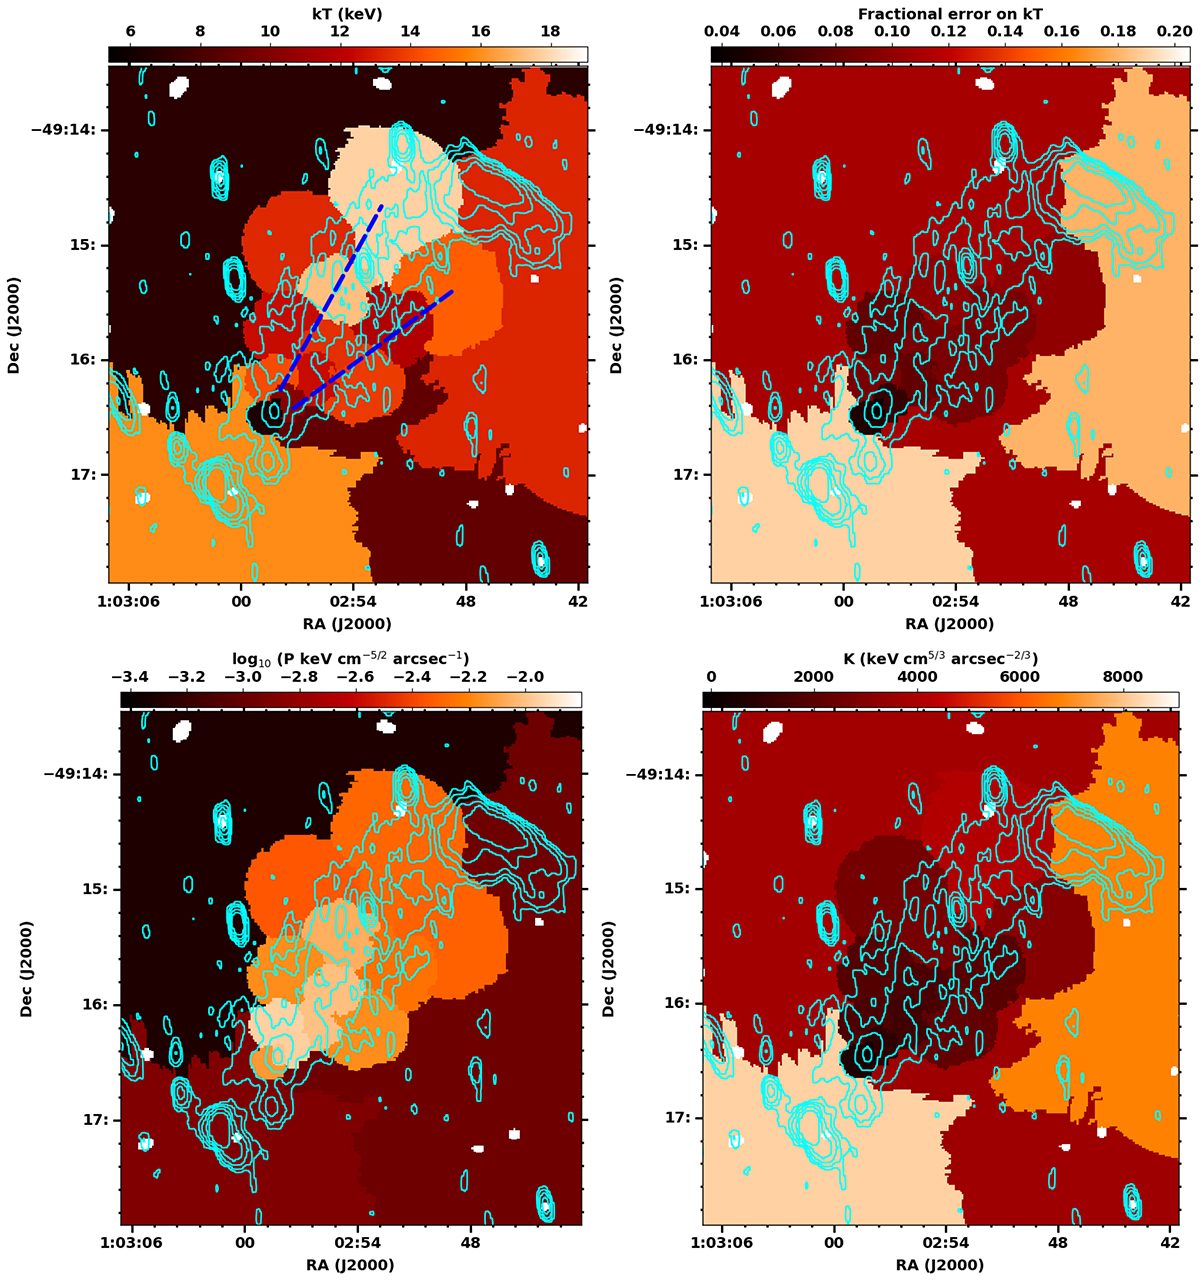
Fig. 10.
Download original image
Top left: X-ray temperature map in color. The dashed blue lines indicate the two X-ray tails that were shown in Fig. 1. Top right: Color map of the percentage error on the temperature (kT). The errors are dominated by the uncertainty on the temperature determination, which is ∼5% in the core region and ∼10% in the rest of the cluster. For the larger bins in the map, the temperature is not constrained. Bottom left: Pseudo-pressure map in logarithmic units in color. Bottom right: Entropy (K) map in color. The 672 MHz contours (cyan) from Figure 3 are overlaid in all the panels.
Current usage metrics show cumulative count of Article Views (full-text article views including HTML views, PDF and ePub downloads, according to the available data) and Abstracts Views on Vision4Press platform.
Data correspond to usage on the plateform after 2015. The current usage metrics is available 48-96 hours after online publication and is updated daily on week days.
Initial download of the metrics may take a while.