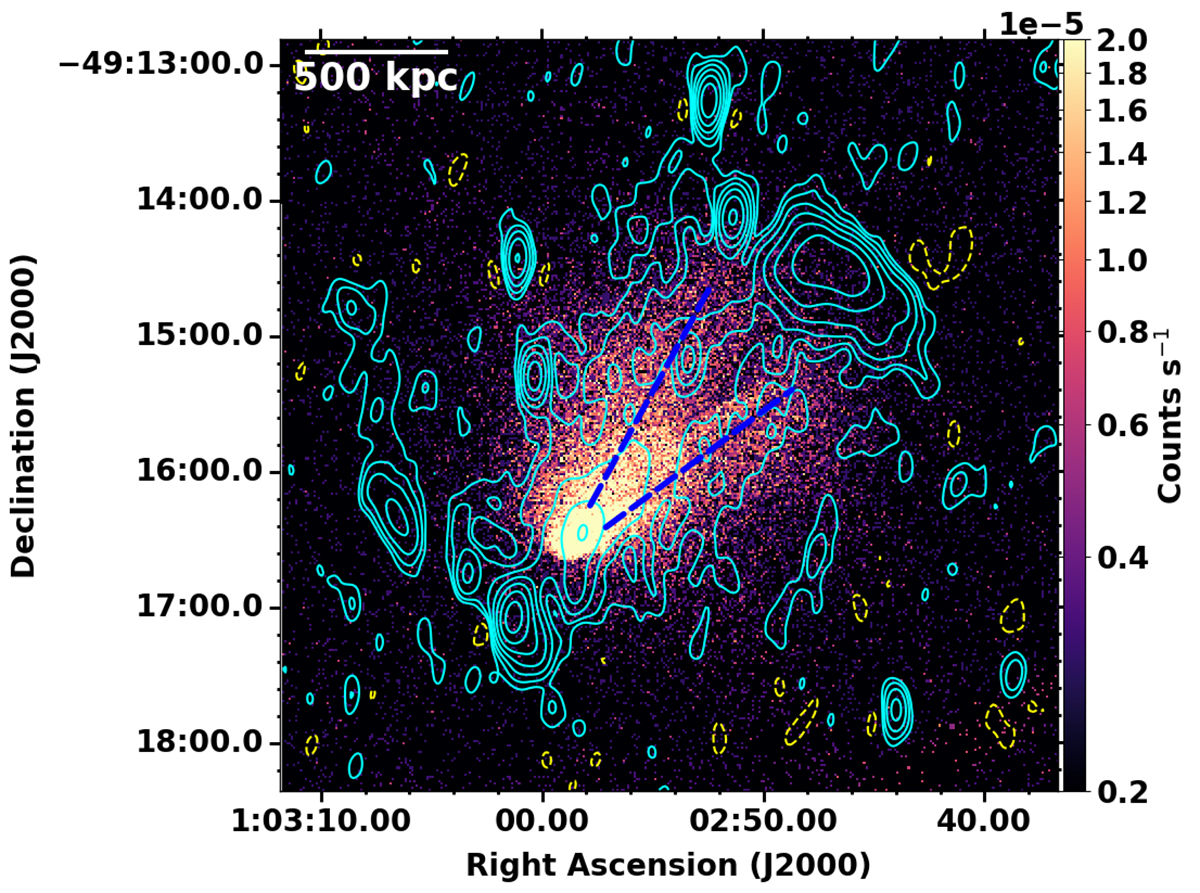
Fig. 1.
Download original image
uGMRT band 3 image. The contours are overlaid on the point-source-subtracted Chandra X-ray image in color. The contour levels are −0.1, 0.1, 0.2, 0.4, etc. mJy beam−1. The positive radio contours are shown by the solid line (cyan), and the negative contours are shown by the dashed line (yellow). The synthesized beam size of the band 3 image is 14.5″ × 5.9″ and the position angle is 3.5°. The dashed blue segments indicate the northern and southern X-ray tails, respectively.
Current usage metrics show cumulative count of Article Views (full-text article views including HTML views, PDF and ePub downloads, according to the available data) and Abstracts Views on Vision4Press platform.
Data correspond to usage on the plateform after 2015. The current usage metrics is available 48-96 hours after online publication and is updated daily on week days.
Initial download of the metrics may take a while.