Fig. 8.
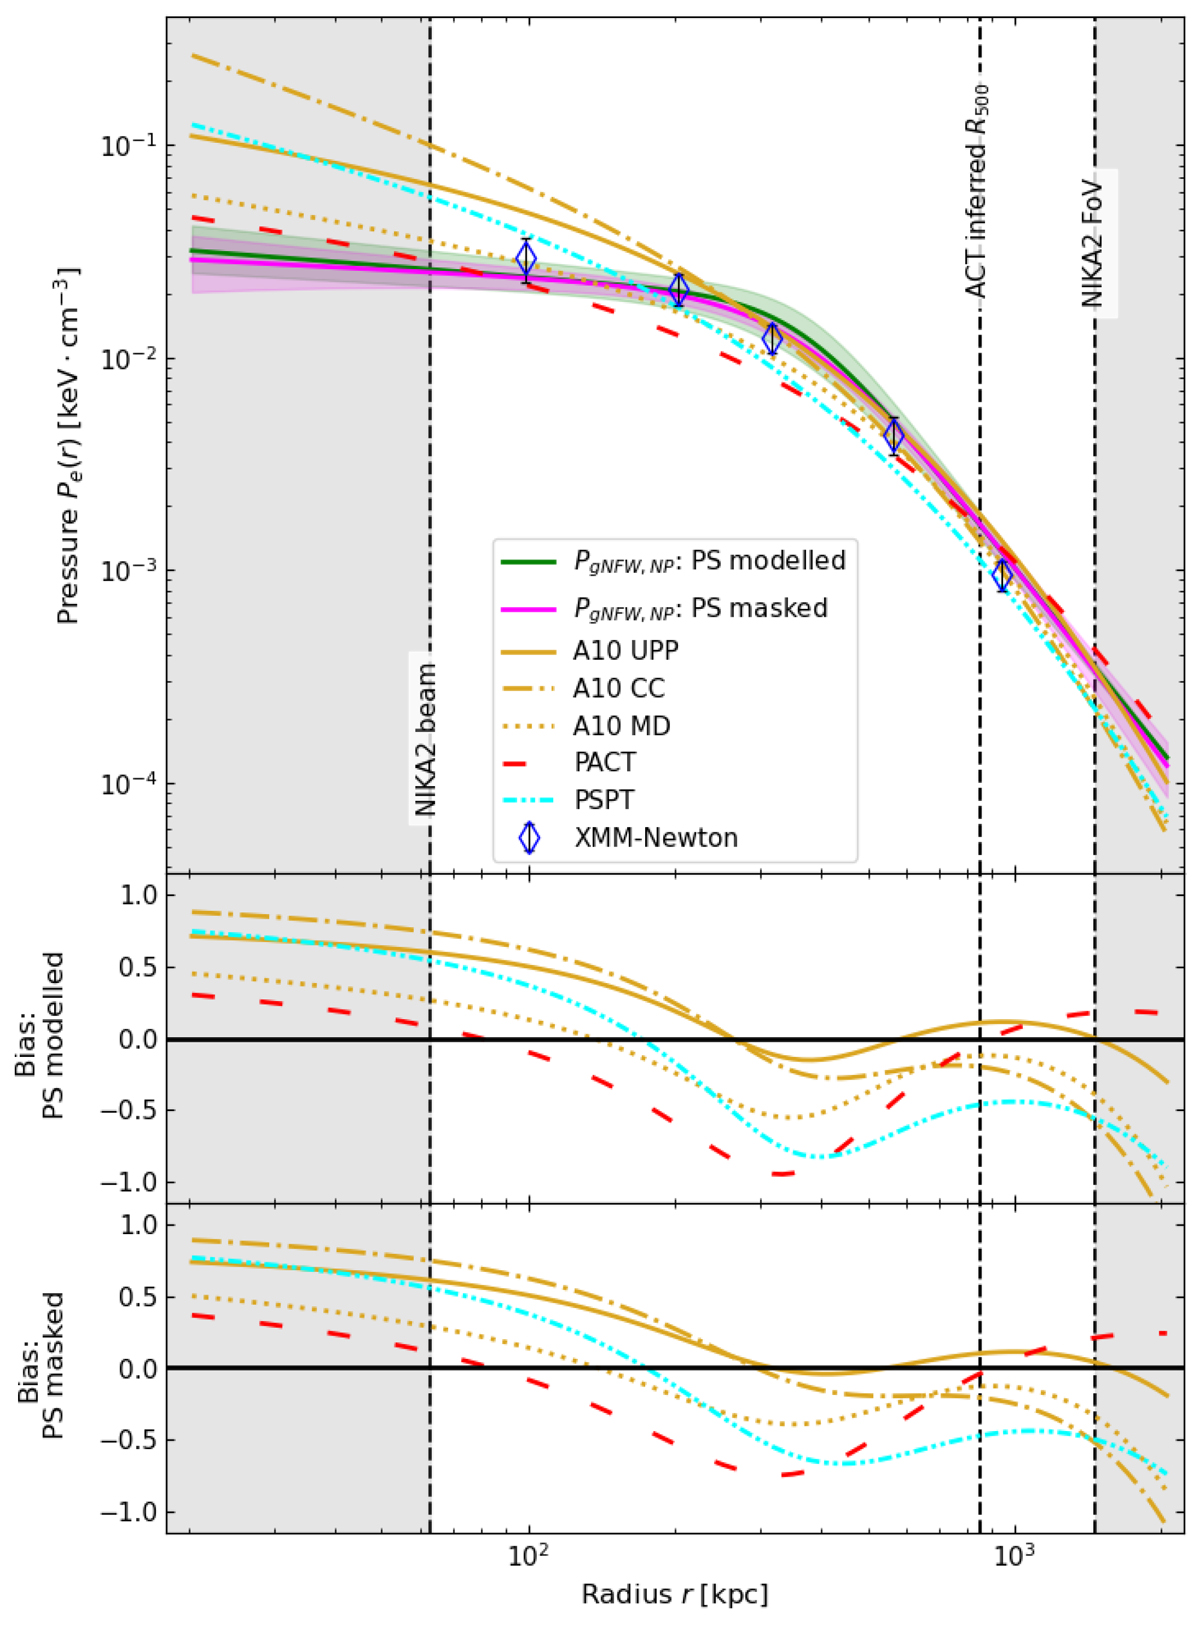
Download original image
Comparison of NIKA2 SZ and XMM-Newton inferred pressure profiles estimated in this work with various universal pressure profile models. The solid (green and magenta) lines, blue empty markers, and vertical lines are the same as Fig. 5. The solid, dotted-dashed, and dotted mustard lines represent a physical pressure profile representing ACTJ0240, which corresponds to the average dimensionless UPP, the profile for the CC sub-sample, and the profile for the MD sub-sample, respectively, in A10. The dashed red line and dashed-dotted cyan line correspond to the average pressure profile models PACT (see Pointecouteau et al. 2021) and PSPT (see Melin & Pratt 2023), respectively. The shaded grey areas depict the regions where we have extrapolated our PgNFW, NP best-fit models from the non-shaded area. The middle panel (bottom panel) shows the bias of our PgNFW, NP profiles with respect to the various pressure profile models.
Current usage metrics show cumulative count of Article Views (full-text article views including HTML views, PDF and ePub downloads, according to the available data) and Abstracts Views on Vision4Press platform.
Data correspond to usage on the plateform after 2015. The current usage metrics is available 48-96 hours after online publication and is updated daily on week days.
Initial download of the metrics may take a while.