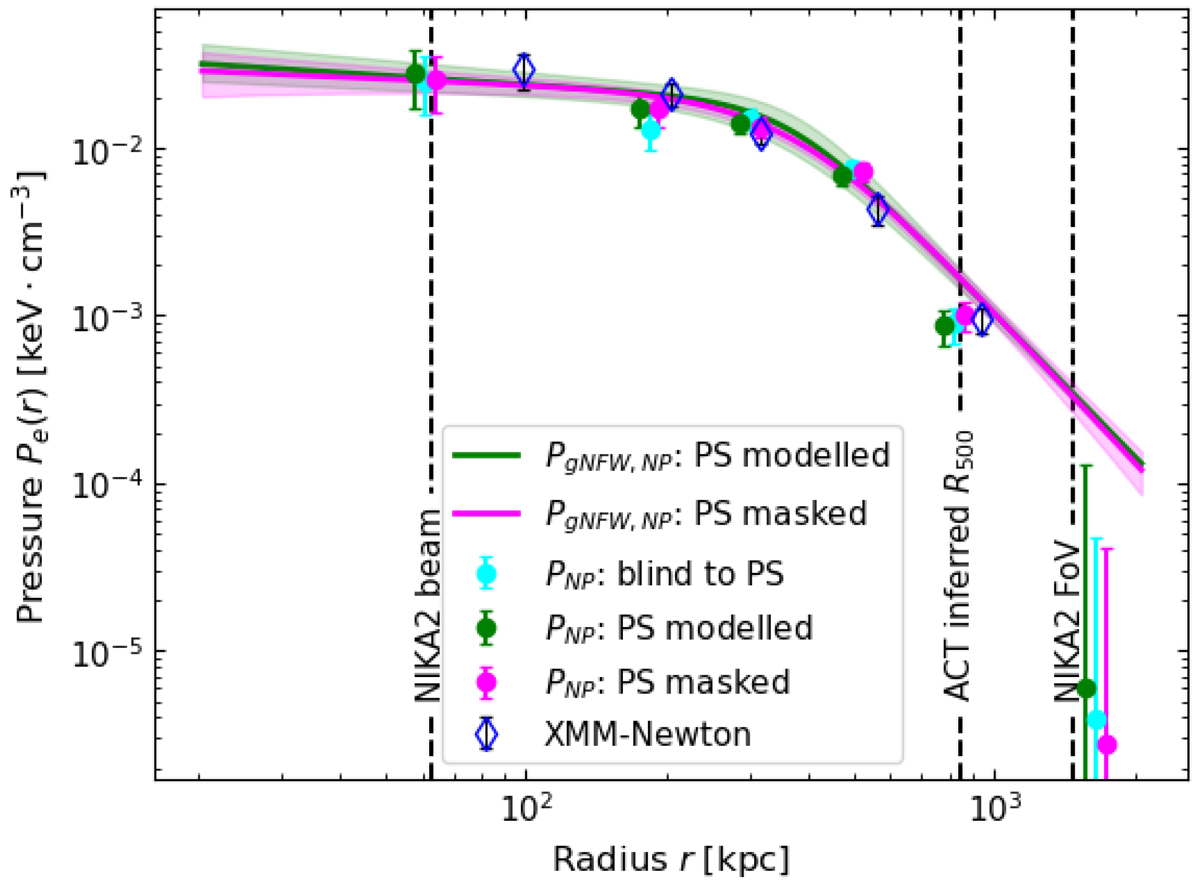
Fig. 5.
Download original image
Pressure profiles of the ICM of ACTJ0240. Dotted markers show results from modelling the NIKA2 150 GHz SZ maps using an NP pressure profile, with 1σ errors. The points are slightly horizontally displaced for visual clarity. Solid lines represent the best-fit gNFW model to the binned NP data, with shaded regions indicating the 16th and 84th percentiles. Blue empty diamonds show the pressure profile obtained from the XMM-Newton. Vertical dashed lines indicate the NIKA2 beam, R500 from the ACT survey, and the NIKA2 FoV, from left to right.
Current usage metrics show cumulative count of Article Views (full-text article views including HTML views, PDF and ePub downloads, according to the available data) and Abstracts Views on Vision4Press platform.
Data correspond to usage on the plateform after 2015. The current usage metrics is available 48-96 hours after online publication and is updated daily on week days.
Initial download of the metrics may take a while.