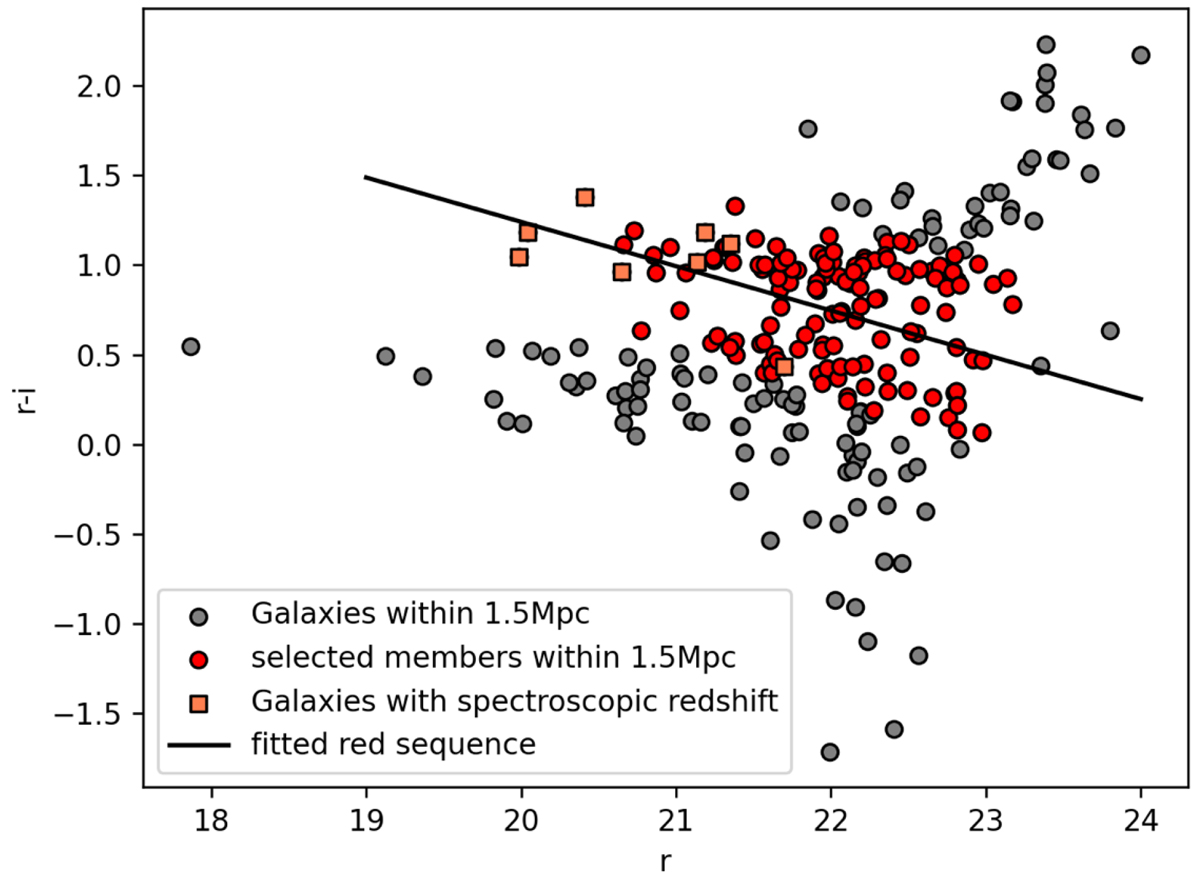
Fig. 4.
Download original image
Colour(r-i)-magnitude(r) diagram for ACTJ0240, created using SDSS data within 1.5 Mpc of the cluster centre. The grey circles depict all the galaxies found at the cluster redshift, within this region. The black solid line depicts the cluster red-sequence estimated using the galaxies with spectroscopic data (shown using orange squares) and the red circles depict member galaxies selected using this red sequence.
Current usage metrics show cumulative count of Article Views (full-text article views including HTML views, PDF and ePub downloads, according to the available data) and Abstracts Views on Vision4Press platform.
Data correspond to usage on the plateform after 2015. The current usage metrics is available 48-96 hours after online publication and is updated daily on week days.
Initial download of the metrics may take a while.