Fig. 2.

Download original image
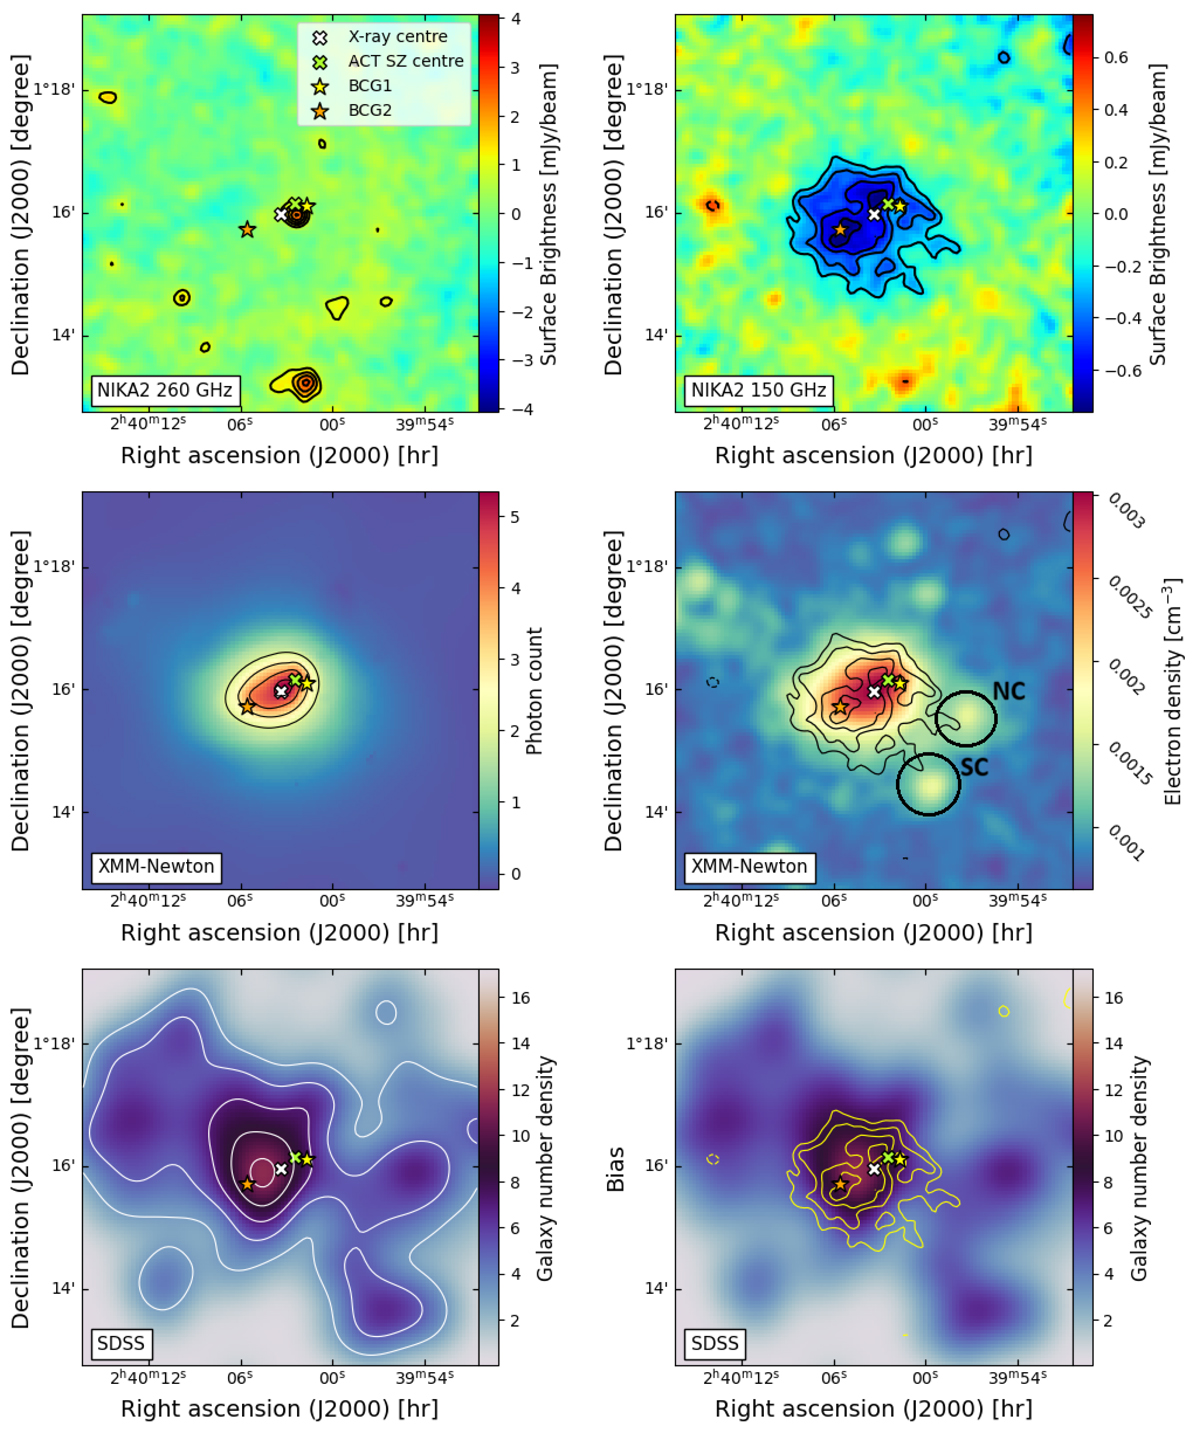
Multi-wavelength view of ACTJ0240. The images are square grids of size 6.5′×6.5′, centred at the X-ray peak of the cluster. In all the images, we show the ACT SZ peak (green cross), the XMM-Newton image peak (white cross), and the two cluster BCGs (yellow and orange stars). Top panels: the 260 GHz (left) and 150 GHz (right) NIKA2 surface brightness images. The black contours in both images show the signal-to-noise (S/N) levels starting from ±3σ, spaced by 2σ. For visualisation, the left (right) map has been smoothed with a Gaussian kernel of 6″ (10″). Central panels: On the left is the wavelet-smoothed XMM-Newton photon count image of the cluster with the black contours depicting signal above 2σ and each successive contours are spaced by 1σ, produced using the technique detailed in Bourdin & Mazzotta (2008). The right side shows the X-ray inferred electron density map (smoothed using a 7.5″ Gaussian kernel), overlaid with SZ contours corresponding to the top-right panel. Bottom panels: Both the images show the galaxy number density of the cluster estimated from SDSS data. The image on the left is overlain with white isodensity contours and the yellow contours in the right-hand side image are the same as the top-right panel.
Current usage metrics show cumulative count of Article Views (full-text article views including HTML views, PDF and ePub downloads, according to the available data) and Abstracts Views on Vision4Press platform.
Data correspond to usage on the plateform after 2015. The current usage metrics is available 48-96 hours after online publication and is updated daily on week days.
Initial download of the metrics may take a while.


